AMSC eyes on $40.18: Golden Genesis fib holding up new ATHAMSC has been bobbing into a Golden Genesis fib at $40.18
Look for a Break-n-Retest to start next leg of uptrend.
Beware of a possible rejection for a high velocity dip.
.
Previous Analysis that gave a PERFECT SWING trade:
Hit the BOOST and FOLLOW for more such a PRECISE and TIMELY charts.
==============================================================
.
AMSC trade ideas

$AMSC - Small Cap Semi with 100% Upside!NASDAQ:AMSC - Could be the next $NVTS...👀
✅ Cup&Handle breakout
✅ Bullish H5 Indictor
✅ Bullish Flow
✅ Volume shelf launch
Only a 1.7B Market cap too! 😱

AMSC eyes on $29.20/40: Key Resistance holding BreakOut to $35AMSC has been grinding upwards in a nice uptrend.
Currently testing a serious resistance $29.20-20.40
Break should continue grind to next res around $35

AMSC | Bullish Momentum Building Breakout in Progress?📈 NASDAQ:AMSC 🚀
American Superconductor (AMSC) is quietly showing strength, and it's time to pay attention. After bouncing off the support zone near $18.80–$19.30, the stock has reclaimed the $20.50–$21.10 entry range, with volume picking up as it challenges key resistance.
🧠 Why it's interesting now:
✅ 56% YoY revenue growth last quarter 📊
✅ LSE:80M in cash, no urgent need for dilution
✅ Clean energy + grid modernization = tailwind
🧩 Technical Setup:
✅ Entry Zone:
$Market price
$19.5-20.5
$18.5
✅ Breakout Trigger: $22.38
🎯 Target 1: $23.50
🎯 Target 2: $25.70
🎯 Stretch Target: $28.00 +
This is a high-beta, high-volatility name — perfect for swing traders who can manage risk. Watch that breakout above $22.38; it could open the door to a fast move toward mid-$20s.
📌 Disclaimer: This is not financial advice. Do your own research before making any trading decisions. I'm not a financial advisor.

American Superconductor–Powering the Future of Energy & Defense Company Overview:
NASDAQ:AMSC is at the intersection of three megatrends: grid modernization, clean energy, and military innovation. With proprietary high-temperature superconducting (HTS) technology and a growing portfolio of energy and defense solutions, the company is moving from niche player to strategic infrastructure enabler.
🔑 Growth Catalysts:
📈 Grid Modernization & NWL Acquisition
Grid segment revenue +56% YoY in Q3 2024, accelerated by NWL integration
NWL expands footprint in grid-scale capacitors, transformers, and military-grade systems
Heightened U.S. focus on grid resiliency due to aging infrastructure and climate pressures
🌬️ Renewable Energy Tailwinds
Wind segment grew +58% YoY, bolstered by demand for advanced turbine control systems
Aligns with global decarbonization and offshore wind investment
🛡️ Defense Expansion
HTS tech used in shipboard systems, degaussing solutions, and high-power electronics
NWL opens doors to increased DoD contracts amid rising national security budgets
🔁 Recurring Revenue & Policy Support
Shift toward long-term service and tech licensing agreements
Backed by U.S. energy and defense spending, including DOE and DOD initiatives
📊 Fundamental Highlights:
Lean balance sheet and operating leverage
Strong YoY revenue acceleration across all segments
Diversified exposure to energy, defense, and renewables
📈 Investment Outlook:
✅ Bullish Above: $21.00–$22.00
🚀 Upside Target: $38.00–$40.00
🎯 Thesis: With breakthrough superconducting tech, strategic acquisitions, and bipartisan support for energy security, AMSC is emerging as a small-cap innovator in critical infrastructure.
#AMSC #GridModernization #DefenseTech #Renewables #Superconductors #EnergyResilience #CleanTech

AMSC – 30-Min Long Trade Setup !📈 🟢
🔹 Asset: American Superconductor Corp. (AMSC – NASDAQ)
🔹 Timeframe: 30-Min Chart
🔹 Setup Type: Symmetrical Triangle Breakout + Retest
📊 Trade Plan – Long Position
✅ Entry Zone: $18.17 (Breakout above triangle + reclaim of yellow level)
✅ Stop-Loss (SL): $17.40 (Below structure & rising trendline)
🎯 Take Profit Targets:
📌 TP1: $18.82 – Recent resistance level
📌 TP2: $20.03 – Key supply zone
📐 Risk-Reward Calculation
🟥 Risk: $0.77/share
🟩 Reward to TP2: $1.86/share
📊 R/R Ratio: ~1 : 2.4 – Clean structure with good reward
🔍 Technical Highlights
📌 Breakout from symmetrical triangle resistance ✔
📌 Clean retest candle forming support ✔
📌 Higher lows showing bullish pressure ✔
📌 Volume building near breakout zone ✔
📉 Risk Management Strategy
🔁 Move SL to breakeven after TP1
💰 Book partial profits at TP1
🚀 Let remaining ride to TP2
🚨 Setup Invalidation If:
❌ Price closes below $17.40
❌ Weak volume confirmation
❌ Rejected sharply from $18.50–$18.80 zone
🔗
#AMSC #BreakoutTrade #SwingSetup #NASDAQ #ProfittoPath #ChartPattern #VolumeBreakout #SmartTrading #RiskReward #TechnicalSetup

AMSC – 15-Min Long Trade Setup !📈 🟢
🔹 Asset: American Superconductor Corp. (AMSC – NASDAQ)
🔹 Timeframe: 15-Min Chart
🔹 Setup Type: Symmetrical Triangle Breakout + Rising Support
📊 Trade Plan – Long Position
✅ Entry Zone: $18.01 (Breakout + trendline confluence)
✅ Stop-Loss (SL): $17.14 (Below ascending trendline + prior low)
🎯 Take Profit Targets:
📌 TP1: $19.16 – Local resistance
📌 TP2: $20.39 – Major resistance zone
📐 Risk-Reward Calculation
🟥 Risk: $0.87/share
🟩 Reward to TP2: $2.38/share
📊 R/R Ratio: ~1 : 2.7 – High reward with tight risk
🔍 Technical Highlights
📌 Breakout from coiled price action ✔
📌 Higher lows forming ascending structure ✔
📌 Strong wick rejection from trendline support ✔
📌 Momentum building after low-volume consolidation
📉 Risk Management Strategy
🔁 SL to breakeven post TP1
💰 Take partial profits at TP1
🚀 Hold remaining to TP2 with trend
⚠️ Setup Invalidation If:
❌ Breakdown below $17.14
❌ Fails to close above yellow zone
❌ Reversal with increasing volume
🚨 Final Thoughts
✔ Clean technical breakout with momentum potential
✔ Perfect fit for short-term swing traders
✔ Compact stop, spacious upside — classic ProfittoPath quality
🔗 #AMSC #BreakoutTrade #NASDAQStocks #ProfittoPath #TechnicalSetup #SwingTrade #VolumeConfirmation #ChartAnalysis #RiskReward #MomentumPlay

AMSC (American Superconductor Corporation) – 30-Min Long Trade ! 🚀
🔹 Asset: AMSC – NASDAQ
🔹 Timeframe: 30-Min Chart
🔹 Setup Type: Bullish Breakout (Symmetrical Triangle Pattern)
📊 Trade Plan (Long Position)
✅ Entry Zone: Above $19.65 (Breakout Confirmation)
✅ Stop-Loss (SL): Below $19.25 (Key Support Level)
🎯 Take Profit Targets
📌 TP1: $20.24 (Resistance Level)
📌 TP2: $20.91 (Extended Bullish Move)
📊 Risk-Reward Ratio Calculation
📉 Risk (SL Distance):
$19.65 - $19.25 = $0.40 risk per share
📈 Reward to TP1:
$20.24 - $19.65 = $0.59 (1:1.47 R/R)
📈 Reward to TP2:
$20.91 - $19.65 = $1.26 (1:3.15 R/R)
✅ Favorable Risk-Reward Ratio toward TP2
🔍 Technical Analysis & Strategy
📌 Symmetrical Triangle Breakout: Price is breaking above the resistance line, confirming bullish momentum.
📌 Support at $19.25: The lower trendline acts as a strong safety level for this trade.
📌 Volume Confirmation Needed: Look for above-average buying volume above $19.65 to validate the breakout.
📌 Resistance at $20.24: A break above this strengthens the bullish case toward TP2.
📉 Trade Execution & Risk Management
📊 Volume Confirmation: Ensure strong buying volume above $19.65 before entering.
📉 Trailing Stop Strategy: Move SL to break-even ($19.65) after hitting TP1 ($20.24).
💰 Partial Profit Booking Strategy
✔ Take 50% profits at TP1 ($20.24), let the rest run toward TP2 ($20.91).
✔ Adjust Stop-Loss to Break-even ($19.65) after TP1 is reached.
⚠️ Risks & Considerations
❌ Fake Breakout Risk: If the price fails to hold above $19.65, exit early.
❌ Confirmation Required: Wait for a 30-min candle close above $19.65 before entering.
🚀 Final Thoughts
✔ Bullish Setup – Strong upside potential.
✔ Momentum Shift Possible – Watch for volume confirmation.
✔ Favorable Risk-Reward Ratio – 1:3.15 toward TP2.
💡 Stick to the plan, manage risk, and trade smart! 🚀📈
🔗 #AMSC #NASDAQ #LongTrade #TradingView #ProfittoPath 💰📊

AMSC – 30-Min Short Trade Setup!📉 🚀
🔹 Asset: American Superconductor Corporation (AMSC)
🔹 Timeframe: 30-Min Chart
🔹 Setup Type: Bearish Breakdown Trade
📌 Trade Plan (Short Position)
✅ Entry Zone: Below $18.60 (Breakout Confirmation)
✅ Stop-Loss (SL): Above $19.61 (Invalidation Level)
🎯 Take Profit Targets:
📌 TP1: $17.29 (First Support Level)
📌 TP2: $15.93 (Extended Bearish Move)
📊 Risk-Reward Ratio Calculation
📉 Risk (SL Distance): $19.61 - $18.60 = $1.01 per share
📈 Reward to TP1: $18.60 - $17.29 = $1.31 (1:1.3 R/R)
📈 Reward to TP2: $18.60 - $15.93 = $2.67 (1:2.64 R/R)
🔍 Technical Analysis & Strategy
📌 Symmetrical Triangle Breakdown – Price is testing the lower trendline, signaling potential downside.
📌 Volume Confirmation Needed – A strong bearish candle below $18.60 confirms entry.
📌 Momentum Shift Expected – Breakdown could lead to $17.29, then $15.93.
📊 Key Resistance & Support Levels
🔴 $19.61 – Resistance / SL Level
🟡 $18.60 – Breakdown Level / Short Entry
⚪ $17.29 – First Support / TP1
🟢 $15.93 – Final Target / TP2
📉 Trade Execution & Risk Management
📊 Volume Confirmation – Ensure strong selling pressure before entering.
📉 Trailing Stop Strategy – Move SL to $18.60 (breakeven) after hitting TP1 ($17.29).
💰 Partial Profit Booking Strategy:
✔ Take 50% profits at $17.29, let the rest run to $15.93.
✔ Adjust SL to breakeven ($18.60) after TP1 is hit.
⚠️ Fake Breakdown Risk
❌ If price moves back above $18.60, exit early to limit losses.
❌ Wait for a strong bearish candle close below $18.60 before entering aggressively.
🚀 Final Thoughts
✔ Bearish Setup Forming – Breakdown signals a potential downside move.
✔ Momentum Shift Expected – Watch for volume confirmation.
✔ Favorable Risk-Reward Ratio – 1:2.64 R/R at TP2 makes this a high-quality trade.
💡 Stick to the plan, manage risk, and trade smart! 📈🔥
🔗 Follow @ProfittoPath for More Trade Setups!
#ProfittoPath 🏆 | #AMSC 📉 | #StockMarket 📊 | #BreakdownTrade 🚀 | #ShortSetup 💰 | #RiskManagement 🔍 | #MarketAnalysis 📈 | #SwingTrading

AMSC Double Cup & Handle Breakout: Big Targets in SightAmerican Superconductor (AMSC) is gearing up with not one, but two Cup & Handle formations, doubling down on its breakout potential.
Double Cup & Handle Power: The first Cup & Handle has already broken out with a target near $35. Now, the second, larger Cup & Handle breakout above $27 is setting sights on an ambitious target around $51—an 89% potential move if the momentum holds.
Bullish Channel & Momentum: AMSC is cruising up within a clean ascending channel, showing no signs of slowing. The SMA 150 is also catching up, suggesting a long-term trend shift could be underway.
Volume & RSI: Rising volume confirms the strength behind these moves, while RSI is flirting with overbought levels. A slight pullback wouldn’t be unexpected, but the bulls look firmly in control.
Bottom Line: With dual Cup & Handle breakouts, strong targets, and solid demand, AMSC’s chart is loaded with potential. This setup has serious momentum—one to watch closely.

AMSC Bullish TradeHere is how I would handle this trade.
Pocket pivot on high volume is a good sign.
I look to sell half first because the base was deep so it may not clear the previous high!

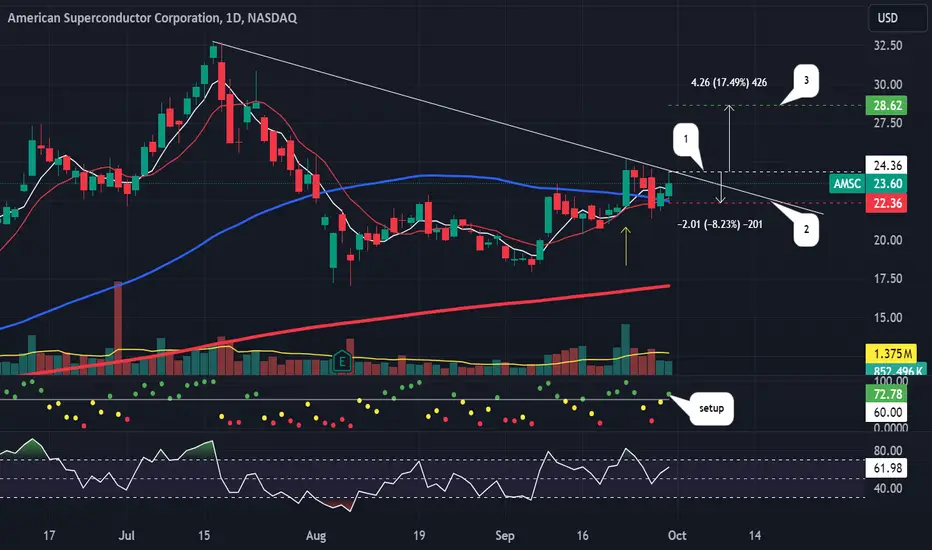
My Watchlist: AMSCAMSC, which recently had high volume and now has a setup signal. I'm looking to enter long near the close of the day if the stock can manage to CLOSE above the last candle highs(1). If triggered, I will then place a stop-loss below (2) and a price target above it (3). Wish me luck!
Technicals look good on $AMSC1. Above the centre EMA
2. Divergence on MACD histogram
3. MACD lines look good
4. Positive volume after the top from 17th July
Lets see if NASDAQ:AMSC keeps the momentum going.
What DO YOU THINK?

AMSC Computer medium cap beats earnings LONGAMSC on the daily chart has went 3X in 7-8 months on the strength of earnings beats and
the tailwinds of the AI supertrend. I see this as an excellent swing long trade to hold into
the next earnings in 3-4 months. AMSC is currently at its ATH and going higher means no
overhead resistance.

AMSC, 5/30-5/30, 10% PROFITAMSC (AMSC) reported earnings of $0.02 per share on revenue of $42.03 million for the fiscal fourth quarter ended March 2024. The consensus estimate was a loss of $0.06 per share on revenue of $36.75 million. The company beat consensus estimates by 133.33% while revenue grew 32.40% on a year-over-year basis.

5/29/24 - $asmc - sidelines, too much risk in this tape into EPS5/29/24 - vrockstar - $asmc - just added to my energy watchlist b/c the growth here L12 months q by q has been pretty impressive. stock has reacted to a lot of this, however, obviously. so $500-$600 mm valuation on $150 of sales is 3.5-4x sales (b/c profitability still scaling), which a. for this cap and b. those non software margins is quite frankly too much to take a position. add to this last time this year the seasonal quarter was a big revenue miss. i'm not close enough to know how much seasonality should be incorporated here, the bogey doesn't look *easy* per se (or difficult either based on recent trends). i'd prefer to keep this on my radar and get a greedier entry, however my bias here is more long than short in the MT/LT. hard enough to own larger caps with similar 20% growth trajectories and profitable - which is where the first bid will come in (generally) and in a risk off environment, these are the caps that get dropped fastest b/c liquidity, valuation/ rates etc.

Playing the Superconductor hypeSeems like LK-99 is coming back around so it's time to watch AMSC
My guess is in a week or two price starts picking up and we get another big move
Position early while protecting downside is all we can do

AMSC MonthlyHaven't followed the developments of the company so mostly a pure-technical call. Monthly cup+handle patterns with targets in highlighted areas. Ignore timeframe, purely for graphical purposes.

Superconductor's Super R:RI like to say that spot (stock) is a superpower.
Trading options over the past few years has taught me a lot about being right at the right time AND being wrong at the right time.
If our absolute cutoff is $7.95 then it gives around -10% downside ignoring fees.
The play isn't soley based on the chart or the hype around LK-99.
It has to be on the overly pessimistic attitude of the average individual who has run across this story and now is convinced it's over because they say so.
They have bias, and perhaps so do I.
Managing risk while maintaining an optimistic view of the future is what excites me most about being in these markets.

$AMSC - Electricity Shortage?After some news, price is settling down. Can be a quick play if it breaks out the $9.50ish mark.

American Superconductor - Floating Crystals, Floating CandlesThe new rage on financial social media is that a new room temperature superconductor has been discovered, and appears to be replicable in labs.
This is significant because superconductors normally have to be either really hot or really cold during their operations.
So, AMSC has Superconductor in its name and is naturally pumping, and has been since May.
The biggest pump was August 1 at 60%, spurred on my a lot of social media chatter, especially in Korean and Chinese.
Greed in the markets is already at extremes, people are convinced new all time highs on indexes are as good as in the bank, and it's very dangerous.
Moreover, you're dealing with hidden geopolitical risks from a Chinese Communist Party being on the edge of collapse that's guilty of the 24-year-long persecution and organ harvesting genocide of Falun Dafa meditation's 100 million practitioners.
And people want to long the top on stuff that's already up 400%+.
The world truly is an asylum.
And look at the monthly bar this has produced with people longing a daily range between $14 and $17.
The weekly candle looks more sane, because at least we're on Tuesday, but it still shows that this swing may have already topped.
So, here's the thing about the fundamentals of this kind of trade:
1. The Superconductor discovery right now is a piece of lead apatite crystal that is capable of majority levitation and diamagnetism when placed on a magnetic plate.
2. The crystal has been made by students in a lab using a paper from Korea.
3. It looks like a little piece of graphite/charcoal. Unless you put it on a magnetic plate, it doesn't even float.
4. Let's say the crystal is truly revolutionary, how many years away from it making its way into a sellable product are you?
5. Why would you think American Superconductor Corporation is going to be the one who licenses something disruptive?
6. Wouldn't TSM, Intel, or AMD, or some Elon Musk/Peter Thiel/Sam Altman-type venture be the ones to steal it?
7. The stock has already quadrupled in price
8. At Tuesday's close, the market cap is $488 billion
9. Look at their earnings results: they bring in $25 million in revenue quarterly
10. Next ER is August 9 post-market. Can you maintain a $500 million market cap when they report $20 million in revenue and the CEO tells investors and banks on the conference call that they aren't going to be able to profit from the discovery?
In essence, you're kind of dealing with a real corporation that's being subjected to something of a Bed Bath and Beyond-style pump and dump.
And this is at a time when greed in the markets is already extreme. People are longing the top on things like Palantir and SOFI without second thought and gettin' paid daily.
Yet the United States credit rating was downgraded today after the Treasury said it wanted to issue another $1.8 trillion worth of debt, and now the Nasdaq and the SPX are gap down on Wednesday futures open.
I discuss this here:
SPX - The Sound of a Shattering Iceberg
I actually think there's a long trade on ASMC over $20 before the hypenstein is over.
But if you don't see it manifest at market open Wednesday and prices lower than $13.31 are traded as the indexes drive a lot of things down, you're probably going back to $10 first, which is just horrific for top longers.
Take a look at the five minute chart.
Tuesday market close was either a big buy or 45 minutes before market close was a big short.
You have to decide for yourself. But sell the news, man, is really a piece of wisdom.
After all, implied volatility is so high that an August 18 at the money call is $4.10, on a $16 stock.
That's a lot of premium and the options sellers just absolutely love your exit liquidity.

AMSC 57% July rise AI tech ( chips) upcoming earnings LONGAMSC has had a great rise since the beginning of the AI revolution. From the overlay of
the anchored VWAP this would be a VWAP breakout that closed the last trading day
with a correction pullback and then a bounce off the POC line of the volume profile.
The natural stop loss for a long trade is directly under the POC line. As a strong bull run stock,
the MACD just showed another line cross above the histogram. Amplitudes are rising. This
sector is scorching hot. Some will call it overextended and overvalued. Buy weakness - yeah for
sure unless its going to get worse. Buy strength when you determine the probability that
it will go higher. This long trade will not wait for me. I will take it and be watchful
for signs of reversal. I do not think that I will see them anytime soon. With earnings coming
this week and trader interest peaking. I will jump in here and watch for good action.
To be safe I will take off part of the position before the earnings.

#AMSC potential resistanceBut given the peculiarities of the newly revealed option position, an even earlier price reversal to the south may occur.
Source: Boston Options Exchange
