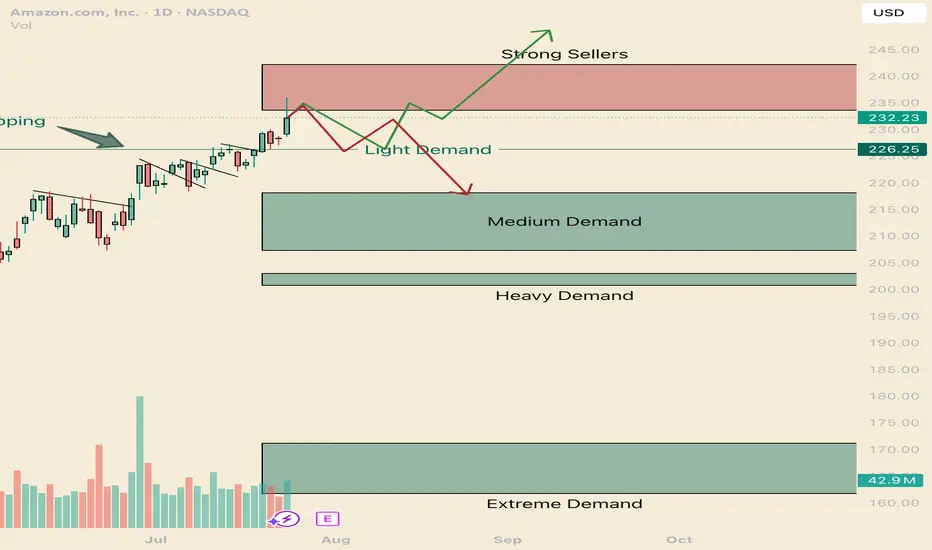
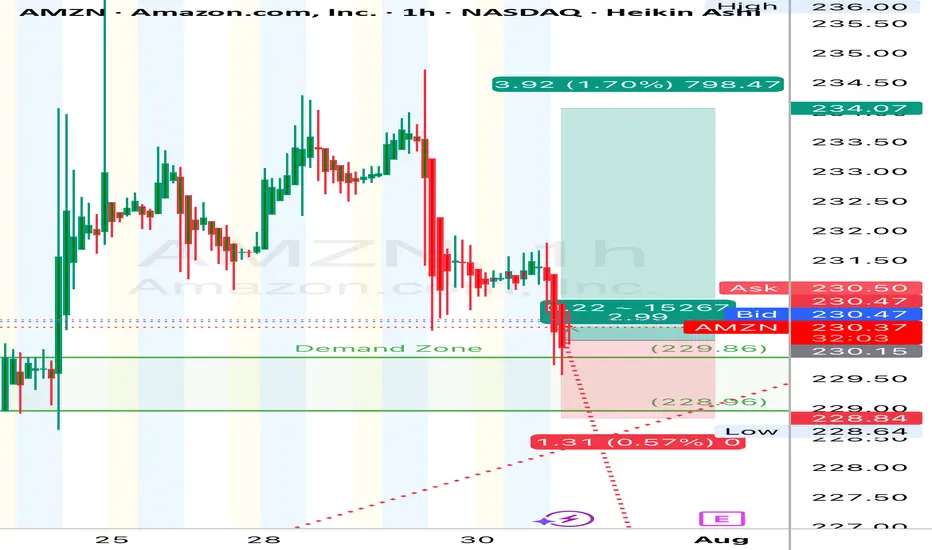
How to navigate the Amazonian Squeeze. AMZNHello I am the Cafe Trader.
This week has been a deep dive on the MAG 7 and today AMZN is up next.
We are going to look at long term and short term opportunities.
We are near the All Time Highs, with one final Seller to get through before making the break.
Today we tested to see if those sellers
Key facts today
Next report date
—
Report period
—
EPS estimate
—
Revenue estimate
—
6.68 USD
59.25 B USD
637.96 B USD
9.65 B
About Amazon.com
Sector
Industry
CEO
Andrew R. Jassy
Website
Headquarters
Seattle
Founded
1994
FIGI
BBG000BVPV84
Amazon.com, Inc. engages in the provision of online retail shopping services. It operates through the following business segments: North America, International, and Amazon Web Services (AWS). The North America segment includes retail sales of consumer products and subscriptions through North America-focused websites such as amazon.com and amazon.ca. The International segment offers retail sales of consumer products and subscriptions through internationally-focused websites. The Amazon Web Services segment involves in the global sales of compute, storage, database, and AWS service offerings for start-ups, enterprises, government agencies, and academic institutions. The company was founded by Jeffrey P. Bezos in July 1994 and is headquartered in Seattle, WA.
Related stocks
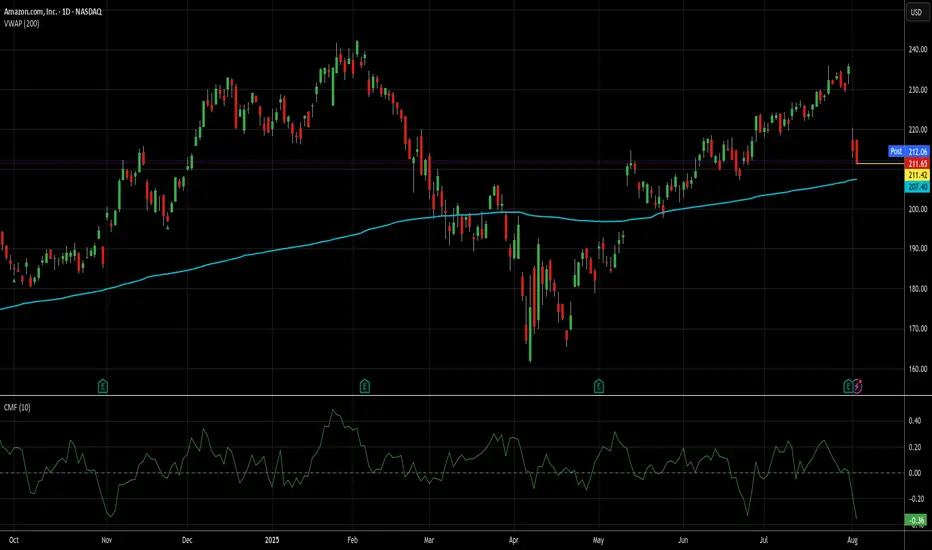
Not a perfect setup, but it's AMZN, so I'm in at 211.65.It may be a touch early to take this trade, but I"d always rather be early than late on AMZN trades. This particular setup isn't exactly like the first 2 ideas I posted about AMZN, but it's been very profitable in general, even if it hasn't done that well on AMZN recently. That said, results of tr
learn how to read and use Angle of Descent
Angle of Descent is the inverse of Angle of Ascent. However, the downtrend runs faster and steeper than the uptrend. WHY? Because the uptrend builds on uncertainty and doubt from retail groups, while Dark Pools and professional traders buy quietly with the that the stock is at bargain prices and wi

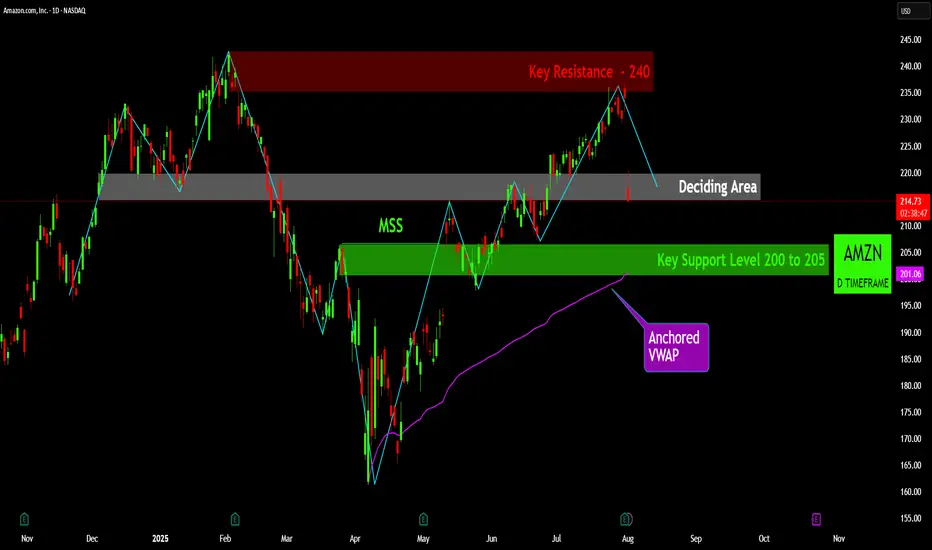
AMZN: The Battle for Direction at a Critical JunctureThe recent price action for Amazon (AMZN) is currently navigating a critical juncture, having pulled back from a significant resistance level and now consolidating within a pivotal "Deciding Area." A detailed review of the key technical levels reveals the following insights:
Key Resistance ($240):
Real Sellers Vs Passive Sellers AMZNHello I am the Cafe Trader.
I was fortunate enough to get an editors pick, and I wanted to expound on how I came to those conclusions.
In this video we talk about passive sellers vs aggressive sellers and how we identify them. Also why it's important to identify these players in the market. This

AMZN is ready to lift offPrice has successfully retest support zone around 185$.
Expecting trend continuation, targets are on chart.
NFA
DYOR

Amazon (AMZN) Shares Rise Ahead of Earnings ReportAmazon (AMZN) Shares Rise Ahead of Earnings Report
Today, 31 July, Amazon is set to release its quarterly earnings after the close of the regular trading session. Available data show that Amazon (AMZN) shares are exhibiting bullish momentum, reflecting positive market expectations:
→ In July, AMZ
8/1/25 - AMZN: new SELL mechanical trading signal.8/1/25 - AMZN: new SELL signal chosen by a rules based, mechanical trading system.
AMZN - SELL SHORT
Stop Loss @ 234.11
Entry SELL SHORT @ 214.75
Target Profit @ 181.53
Analysis:
Higher timeframe: Prices have stayed below the upper channel line of the ATR (Average True Range) Keltner Channel and

(AMZN) | 1H Chart Long
“Buyers defended the zone hard. Tight bull flag breakout setup forming after the demand tap. Looks like this thing wants to take another leg up. Clean R/R if managed tight.”
Price surged impulsively from mid-July lows, followed by a shallow correction—suggestive of a micro **Wave 4**.
* Current b
AMZN - LONG Swing Entry PlanNASDAQ:AMZN - LONG Swing Entry Plan
Entry Zone 1: $220.00 – $217.00
→ Open initial position targeting +8% from entry level.
Entry Zone 2: $212.00 – $209.00
→ If price dips further, average down with a second equal-sized entry.
→ New target becomes +8% from the average of Entry 1 and Entry 2.
Edi

See all ideas
Summarizing what the indicators are suggesting.
Neutral
SellBuy
Strong sellStrong buy
Strong sellSellNeutralBuyStrong buy
Neutral
SellBuy
Strong sellStrong buy
Strong sellSellNeutralBuyStrong buy
Neutral
SellBuy
Strong sellStrong buy
Strong sellSellNeutralBuyStrong buy
An aggregate view of professional's ratings.
Neutral
SellBuy
Strong sellStrong buy
Strong sellSellNeutralBuyStrong buy
Neutral
SellBuy
Strong sellStrong buy
Strong sellSellNeutralBuyStrong buy
Neutral
SellBuy
Strong sellStrong buy
Strong sellSellNeutralBuyStrong buy
Displays a symbol's price movements over previous years to identify recurring trends.
Curated watchlists where AMZN is featured.


Frequently Asked Questions
The current price of AMZN is 223.13 USD — it has increased by 4.00% in the past 24 hours. Watch Amazon.com stock price performance more closely on the chart.
Depending on the exchange, the stock ticker may vary. For instance, on NASDAQ exchange Amazon.com stocks are traded under the ticker AMZN.
AMZN stock has fallen by −4.03% compared to the previous week, the month change is a −0.31% fall, over the last year Amazon.com has showed a 33.97% increase.
We've gathered analysts' opinions on Amazon.com future price: according to them, AMZN price has a max estimate of 306.00 USD and a min estimate of 209.00 USD. Watch AMZN chart and read a more detailed Amazon.com stock forecast: see what analysts think of Amazon.com and suggest that you do with its stocks.
AMZN reached its all-time high on Feb 4, 2025 with the price of 242.52 USD, and its all-time low was 0.07 USD and was reached on May 22, 1997. View more price dynamics on AMZN chart.
See other stocks reaching their highest and lowest prices.
See other stocks reaching their highest and lowest prices.
AMZN stock is 2.45% volatile and has beta coefficient of −0.05. Track Amazon.com stock price on the chart and check out the list of the most volatile stocks — is Amazon.com there?
Today Amazon.com has the market capitalization of 2.37 T, it has increased by 0.42% over the last week.
Yes, you can track Amazon.com financials in yearly and quarterly reports right on TradingView.
Amazon.com is going to release the next earnings report on Oct 23, 2025. Keep track of upcoming events with our Earnings Calendar.
AMZN earnings for the last quarter are 1.68 USD per share, whereas the estimation was 1.33 USD resulting in a 26.44% surprise. The estimated earnings for the next quarter are 1.54 USD per share. See more details about Amazon.com earnings.
Amazon.com revenue for the last quarter amounts to 167.70 B USD, despite the estimated figure of 162.43 B USD. In the next quarter, revenue is expected to reach 177.16 B USD.
AMZN net income for the last quarter is 18.16 B USD, while the quarter before that showed 17.13 B USD of net income which accounts for 6.05% change. Track more Amazon.com financial stats to get the full picture.
No, AMZN doesn't pay any dividends to its shareholders. But don't worry, we've prepared a list of high-dividend stocks for you.
As of Aug 7, 2025, the company has 1.56 M employees. See our rating of the largest employees — is Amazon.com on this list?
EBITDA measures a company's operating performance, its growth signifies an improvement in the efficiency of a company. Amazon.com EBITDA is 135.70 B USD, and current EBITDA margin is 19.15%. See more stats in Amazon.com financial statements.
Like other stocks, AMZN shares are traded on stock exchanges, e.g. Nasdaq, Nyse, Euronext, and the easiest way to buy them is through an online stock broker. To do this, you need to open an account and follow a broker's procedures, then start trading. You can trade Amazon.com stock right from TradingView charts — choose your broker and connect to your account.
Investing in stocks requires a comprehensive research: you should carefully study all the available data, e.g. company's financials, related news, and its technical analysis. So Amazon.com technincal analysis shows the neutral today, and its 1 week rating is buy. Since market conditions are prone to changes, it's worth looking a bit further into the future — according to the 1 month rating Amazon.com stock shows the buy signal. See more of Amazon.com technicals for a more comprehensive analysis.
If you're still not sure, try looking for inspiration in our curated watchlists.
If you're still not sure, try looking for inspiration in our curated watchlists.