AMZN Sitting on a Key Launchpad – What’s Next? for July 14🧠 GEX Analysis & Option Strategy:
* Gamma Wall / Resistance: $225
* Next Major Call Walls: $227.5 → $230 → $235
* Call Side Dominance: 13.3% Calls, low IVR at 27.4, IVx avg 38.9
* Put Support: $217.5 / $213.5
* GEX Bias: Mildly bullish bias above $225 — price is floating at Gamma Wall.
🟢 Bullish Option Play:
* Scenario: A breakout above $227.5 could ignite a gamma squeeze to $230–$235.
* Strategy:
* Buy AMZN 230C (7/19 or 7/26 expiry) on breakout above $227.6
* Stop: Break below $224
* Target: $230 → $234
* Lower IV makes calls cheaper; strong momentum + low IV = favorable R/R.
🔴 Bearish Hedge:
* Scenario: Rejection at $227.5 and fall below $224 zone
* Strategy:
* Buy AMZN 220P or 217.5P (7/19 expiry) if price breaks below $224.
* Target: $217 → $213
* Only valid if we break structure below trendline and BOS flips.
📈 1-Hour Chart Technical Outlook (Smart Money Concepts):
* CHoCH → BOS → Retest is confirming bullish structure.
* Price broke out of prior range (purple box around $224–$225).
* Current Setup: Minor pullback to the OB or top of range ($224.5–$225) is underway.
* Structure favors retest long entries unless we break the ascending trendline.
Key Levels:
* Support Zones:
* $224.50 (retest demand/OB)
* $222.26 (ascending trendline + structure confluence)
* Resistance Targets:
* $227.5 → $230 → $232.5 (GEX targets)
📌 Long Setup:
* Entry: $224.6–$225 (on OB retest)
* Stop: $222.25
* Target: $230–$232.5
* Confirmation: Look for bullish candle at the retest zone
⚠️ Bearish Scenario:
* If price fails $224 and breaks structure at $222.25, anticipate reversal into $219.70–$217 zone. Watch price reaction there for potential swing support.
🧭 Thoughts & Summary:
* AMZN has triggered a clean BOS and now consolidates just under a GEX breakout level.
* The next move will likely be decided early in the session — either a strong push through $227.5 → gamma ramp toward $230+, or failure and fade back toward $222–$219.
* Call buyers may find a good breakout play while keeping tight stops under the OB.
Disclaimer: This analysis is for educational purposes only and does not constitute financial advice. Always do your own research and trade responsibly.
AMZN trade ideas

AmazonAmazon needs small correction and further push up towards 235 level.
Disclosure: We are part of Trade Nation's Influencer program and receive a monthly fee for using their TradingView charts in our analysis.
AMZN Ending DiagonalFrom an Elliott Wave point of view, we could be near a downside correction (wave C).
The rise from late May doesn´t have the same momentum, and looks like an ending diagonal.
A break from the bottom of the ascending wedge would indicate wave C is in progress

AMZN Near Critical Pivot AMZN Near Critical Pivot – Option Traders, Watch These GEX Levels Carefully!
🧠 GEX Analysis for Options Trading:
Amazon is sitting right below its Gamma Wall at $225, which aligns with the highest positive NETGEX, suggesting a significant resistance zone. There's a clear call wall stack at $227.5 and $230, with GEX values ramping up between $223.5 to $232.5, pointing to a possible squeeze if price starts reclaiming the $222.5–$225 range. However, the current rejection confirms short-term hesitation.
* Put Support builds around $215, with the PUT wall at $212.5 and heavy GEX defense at $217.5.
* Current GEX sentiment leans slightly bullish (📗), but with only 9.8% calls and IVR/IVX at 3.1/3.5, the market seems cautious—no extreme positioning or imbalance.
* IV is relatively low, which means option premiums are cheap—ideal for debit spreads or directional calls if price starts reclaiming $222.
🟢 If price breaks back above $222.5 with volume, consider long calls targeting $225–$230.
🔴 If it breaks down below $217.5 with momentum, puts toward $215 or even $212.5 become attractive.
📉 1-Hour Chart Technical Outlook:
Price structure has clearly shifted bearish following a confirmed CHoCH (Change of Character) beneath a previously bullish zone around $223–$224. There's been a break of trendline support, and price is currently consolidating just above the $217.5–$218.75 key support zone, which aligns with HVL and GEX defense.
* Previous BOS and CHoCH zones have now flipped into supply, and unless bulls reclaim $222.5, rallies may be sold into.
* A liquidity sweep could develop toward $215 or $212.5 before any rebound.
* Volume spike on the drop shows seller aggression. Reclaiming the broken OB (purple box) could flip bias back short-term bullish.
🟢 Scalp Long above $220.5 toward $222.5–$224 if buyers step in on reclaim.
🔴 Scalp Short below $217.5 targeting $215–$213.
⛔ Stay out in the chop zone between $218–$220. Let the market show its hand.
🎯 Key Trade Suggestions:
* Call Option: Break/retest $222.5 → Buy $225C / $230C (Jul 12/19 expiry)
* Put Option: Break $217.5 → Buy $215P / $212.5P (Jul 12/19 expiry)
* Spread Idea: If long bias confirmed, $222.5/$227.5 call debit spread offers low IV play
This analysis is for educational purposes only and does not constitute financial advice. Always do your own research and manage your risk before trading.

AMAZON STRONG UPTREND|LONG|
✅AMAZON is going up
Now and the stock made a bullish
Breakout of the key horizontal
Level of 220$ and the breakout
Is confirmed so we are bullish
Biased and we will be expecting
A further bullish move up
LONG🚀
✅Like and subscribe to never miss a new idea!✅
Disclosure: I am part of Trade Nation's Influencer program and receive a monthly fee for using their TradingView charts in my analysis.

AMZN Coiled at Key Gamma Level! Trade Setup Inside📊 GEX (Options Sentiment) Analysis – AMZN
* Current Price: $223.20
* Gamma Wall (Call Resistance): $225 – Highest Net GEX, significant resistance zone.
* CALL Walls: Stack from $225 → $230 → $232.5 → $235
→ Suggests upside resistance builds fast; option sellers may try to cap the rally here.
* PUT Wall Support: Cluster at $215 → $212.5 → $210
* GEX Sentiment:
* GEX: ✅ (Green)
* IVR: 32.2 | IVx Avg: 35.6
* CALLs Positioning: Low (5.9%), moderate skew
* Interpretation:
Price pinned near $225 likely due to gamma forces. Any close above could trigger a quick gamma chase toward $230–232+. But failure = fast fade back to $215 support.
📌 Options Strategy Suggestion:
* Bullish Setup: Wait for break/close > $225. Consider vertical debit spreads (e.g., 225c/230c) for limited risk.
* Bearish Rejection: If AMZN gets stuffed at $225 again, short-term PUT spreads toward $215 are viable (e.g., 222p/215p).
🕐 1-Hour Price Action + SMC Intraday Trade Plan
* Structure:
* BOS → CHoCH → Sideways in tight range between $223–224.50
* AMZN is consolidating inside a tight breaker block zone under $225.
* Uptrend channel still valid with higher lows holding.
* Support: $221.88 → $218.75
* Resistance: $224.66 → $227.12
* Bias: Neutral to mildly bullish unless $221 fails.
🔍 Intraday Trade Scenarios
1. Breakout Play (Bullish):
* Trigger: 1H candle closes above $224.66 with volume
* Entry: $225.10
* Target: $227.10 → $230
* Stop: $222.80
2. Fade Play (Bearish):
* Trigger: Break below $221.88 with CHoCH
* Entry: $221.60
* Target: $218.75 → $217.00
* Stop: $223.40
Watch the box: AMZN is stuck in a decision zone. Don't chase. Let it break first.
Final Thoughts:
AMZN is coiled tightly beneath its Gamma Wall. A clean break could trigger aggressive movement either way, so position sizing and stop discipline are critical. Avoid overtrading inside the box.
Disclaimer: This analysis is for educational purposes only and does not constitute financial advice. Trade responsibly and manage your risk.

Amazon I Strong Bullish Outlook Welcome back! Let me know your thoughts in the comments!
** Amazon Analysis - Listen to video!
We recommend that you keep this pair on your watchlist and enter when the entry criteria of your strategy is met.
Please support this idea with a LIKE and COMMENT if you find it useful and Click "Follow" on our profile if you'd like these trade ideas delivered straight to your email in the future.
Thanks for your continued support!Welcome back! Let me know your thoughts in the comments!

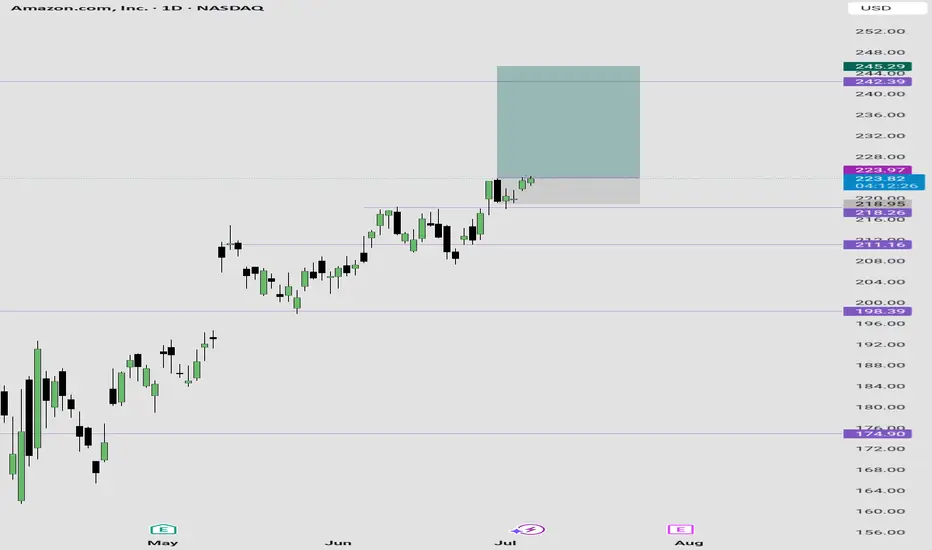
Amazon Long IdeaBuying Amazon shares here...
Reason:
Bouncing off support with good bullish price action candles.
I expect the price to reach $245 per shares between now and next week Friday....
My stop loss price is on the chart.
AMZN Gamma Setups + Trade Plan for July 7📡 GEX-Based Option Trading Analysis
Amazon (AMZN) shows bullish option flow into next week. The GEX map highlights the following:
* Highest Net GEX sits at 225, acting as a strong magnetic price level / resistance zone.
* There’s a Call Wall cluster at 225–230, which could cap short-term upside unless we break through with strong momentum.
* IVR: 27.5 — moderately elevated, giving decent premium for calls.
* Calls: 8.8% vs. Puts: neutral – bullish skew with gamma support underneath.
* Support zone: 215–213 (GEX floor + HVL + PUT wall).
* A break above 226 opens doors to a potential squeeze into 230–232.
🟢 Trade Idea for Options:
* Directional Bullish Bias above 223.
* Consider buying July 12th 225C or vertical 223/230C debit spread for a lower risk play.
* Use tight stop if price fades below 219.75.
📈 1-Hour Chart Technical Setup
From the 1H chart:
* AMZN broke structure (BOS) above 223 and reclaimed the trendline.
* Price has broken out of the previous supply zone (highlighted in purple) and is retesting it now.
* 9/21 EMA shows bullish crossover; price holds above trendline with rising volume.
* Strong support confluence around 219–221 from CHoCH, EMA, and structure lows.
* Bias remains bullish continuation as long as price holds 221.60–222.
🧠 Scalping Plan (Intraday):
* Long setup: Look for retest entry at 223.00 or 222.50, stop below 221.50, target 225.60, then 227.50.
* Avoid chasing if price gaps above 226. Wait for retrace back into structure.
* Bearish invalidation only below 219.
🎯 Final Thoughts:
* AMZN is entering a gamma-rich zone. Watch 225 reaction — breakout could spark a run to 230+.
* Options look primed for bullish plays. Chart structure supports a breakout continuation.
* Trade with tight stop-losses, especially ahead of CPI next week.
This analysis is for educational purposes only and does not constitute financial advice. Always manage risk and do your own research.

AMAZON Will Keep Growing! Buy!
Hello,Traders!
AMAZON is trading in an
Uptrend and the stock made
A breakout and retest of the
Key horizontal support
Of 218$ and is going up again
So we are bullish biased
And we will be expecting
A further bullish move up
Buy!
Comment and subscribe to help us grow!
Check out other forecasts below too!
Disclosure: I am part of Trade Nation's Influencer program and receive a monthly fee for using their TradingView charts in my analysis.

APPLE: 1st 1D Golden Cross in 2 years just formed.Apple is bullish on its 1D technical outlook (RSI = 67.490, MACD = 1.760, ADX = 17.850) and yesterday it started forming the first 1D Golden Cross in more than 2 years. This signals the extension of the 2nd major bullish wave of the 3 year Channel Up. The previous one made an incredible extensino to +78.49%. That gives us the target to work with for the rest of the year. The trade is long, TP = $290.
## If you like our free content follow our profile to get more daily ideas. ##
## Comments and likes are greatly appreciated. ##

$AMZN - support at $218.63 . next level at $225AMZN - Stock holding support on the trendline. Stock is also holding flat top support at $218.56. With prime day coming soon, we can see a spike towards to $225 and $230 . decent call flow coming in.

AMZN Short Market Structure Analysis
Break of Structure (BOS)
A bullish run culminated in a BOS to the upside, which typically signals a short-term bullish intent. However, this move acts as a liquidity grab, sweeping buy-side liquidity above the prior high.
Liquidity Sweep & Rejection
Price taps into the higher time frame sell zone, indicated by the shaded red region. The wick into this zone triggers stop-losses from breakout buyers and activates institutional selling interest, leading to a swift rejection.
Inducement & Trap Zones
Several trap zones are clearly mapped out on the descent:
These green areas represent engineered liquidity pockets where buy-side participants are induced to enter prematurely.
As price retraces into these zones, retail traders anticipate reversals, but these retracements serve only to fuel the continuation of the bearish leg.
Lower Liquidity Target (XXX zone)
The chart ultimately projects a move toward the equal lows marked near the $207 level—an area rich in sell-side liquidity. The consistent failure to break lower previously forms a pool of resting liquidity that smart money seeks to exploit.
Liquidity Engineering
The green dots on prior highs mark liquidity collection points—zones where retail buyers are most active.
The higher time frame red zone provides confluence for distribution and is a classic example of liquidity injection followed by reversal.
The step-by-step sell-off shows clear liquidity traps, where short-term demand is absorbed, reinforcing the bearish continuation.
Risk Management Considerations
Stop Placement: Must be placed above liquidity sweep highs and not within internal trap zones to avoid being manipulated out of the trade.
Scaling In: Given the presence of multiple trap zones, one could consider scaling in as price confirms rejection from each zone.
Targeting: A conservative target would be the liquidity void near $207; aggressive traders might look beyond if the structure accelerates.

AMZN Is Coiling Up for a Gamma Push — Don’t Sleep on This Zone🔍 GEX Outlook & Option Bias:
Amazon (AMZN) is sitting right at the heart of a bullish Gamma setup. The 220–225 zone is where the action is:
* Highest Net Positive GEX sits at 225 — major gamma magnet and potential squeeze target.
* 49.56% Call Wall at 222.5 confirms call-dominant sentiment.
* IVR at 27.4 and IVX avg 32.9 show room for expansion.
* Call dollar flow is 58%, signaling buyers are still active.
📌 GEX Implication: Price above 217.5 opens door for a push into 222.5 → 225. This is a clean Call Entry Zone for 0DTE or 2DTE scalpers looking for quick momentum moves into gamma walls.
📈 TradingView Chart Analysis (1H):
From the second chart:
* AMZN broke bullish structure last week and is now consolidating after the CHoCH near 218.
* The price is respecting the uptrend channel and sitting just above the midline support.
* Volume is steady and bullish OBs below offer strong bounce potential.
🟢 Trading Idea:
Call Setup (if price stays above 219.4):
* 🎯 Entry: 220–221
* 🎯 Target: 222.5 → 225
* 🛑 Stop: 217.5 (below bullish OB & PUT support)
Put Setup (if price loses 217.5 with volume spike):
* 🚨 Entry: below 217.5
* 🚨 Target: 216.7 → 212
* 🛑 Stop: 220.3
🎯 Bias & Final Thought:
Market wants to test 222.5 and possibly gamma squeeze to 225 if buyers step up. If it fails to hold 219.4, fade it down into the lower OB zone around 212.
Watch volume at support — low volume means a trap; high volume confirms real move.
Disclaimer: This content is for educational purposes only and not financial advice. Trade at your own risk.
Amazon getting ready for another leg downAmazon is now in consolidation mode right below the 200MA which also happens to line up with a previous area of resistance. As long as it continues to consolidate below the 200MA, look for another leg down. If it breaks above the 200MA and closes an entire candle above then that would cancel the bearish set up.
Nothing good ever happens below the 200

A Long Trade Opportunity for Next WeekCurrent Price: $223.30
Direction: LONG
Targets:
- T1 = $229
- T2 = $236
Stop Levels:
- S1 = $218
- S2 = $212.57
**Wisdom of Professional Traders:**
This analysis synthesizes insights from thousands of professional traders and market experts, leveraging collective intelligence to identify high-probability trade setups. The wisdom of crowds principle suggests that aggregated market perspectives from experienced professionals often outperform individual forecasts, reducing cognitive biases and highlighting consensus opportunities in AMZN.
**Key Insights:**
Amazon currently exhibits strong upward potential, making it a compelling buy for the upcoming week. Following its bullish market activity and position as a sector leader in technology and consumer discretionary, AMZN faces an environment conducive to breaking through key resistance levels. Additional pullbacks may offer excellent entry opportunities, while upside price targets are well-defined, paving the way for confident trade setups.
The company’s fundamentals remain strong, with an expansive portfolio offering resilience against broader economic pressures. Its leadership in both e-commerce and technological innovation provides a sturdy base for continued investor confidence. Moreover, technical indicators signal bullish continuation patterns, adding further conviction to near-term pricing action predictions.
**Recent Performance:**
Amazon has recently surged past critical resistance zones, reinforced by robust trading volume and bullish price action. Its upward trajectory has outperformed broader market benchmarks, marking a compelling shift in investor sentiment. Last week's breakout performance places AMZN at the forefront of mega-cap technology rallies alongside key competitors such as Alphabet and Meta. This momentum aligns with its broader corporate strategy of innovation and market dominance.
**Expert Analysis:**
Top analysts currently rate Amazon highly for its potential within the near-term trading window. They underscore its favorable technical setup, with momentum indicators flashing bullish signals. Additionally, strategic bets on long-term growth industries, including cloud computing and artificial intelligence, bolster AMZN’s fundamental attractiveness. However, the broader stock market’s volatility should be monitored to mitigate any potential risks from sector-driven pullbacks or negative macroeconomic developments.
**News Impact:**
Recent news about innovations in automation and AI within the tech sector provides supportive momentum for Amazon’s stock price. Positive developments in cross-sector leadership reinforce its bullish sentiment. Similarly, renewed investor appetite for technology stocks boosts AMZN’s prospects, creating favorable tailwinds that could propel shares upward toward noted resistance levels. Any signs of improvement in consumer discretionary spending may further amplify its price rallies moving forward.
**Trading Recommendation:**
Amazon’s robust recent performance and prominent market positioning make it a highly appealing option for long trades in the near term. Its technical structure supports a bullish outlook, with well-defined upside targets and protective downside levels. Traders should wait for minor pullbacks or dips early next week to establish positions, leveraging the stock’s resilience within critical support zones to balance risk while maximizing reward potential.

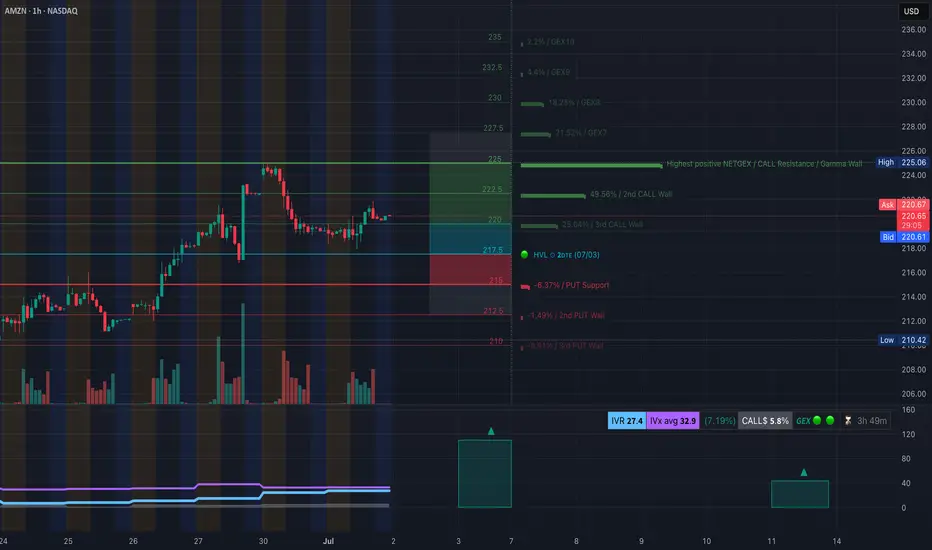
AMZN Monday Setup: Will $225 Hold or Fold? Key Levels for Trader🚨GEX-Based Options Sentiment (as of Sunday Close):
* $225 – Key Call Wall & Highest Positive GEX level: Strong resistance. AMZN closed right below this — very telling.
* $220 – GEX8 / 2nd Call Wall: Gamma magnet zone. Price may gravitate here early in the session.
* $210 – Strong Put Wall + HVL zone: Critical gamma support; if broken, opens path toward $207–$200.
* IVR: 14.9 (low) — Options premiums are cheap. Good for debit spreads or directional calls/puts.
* Calls flow: 3.8% bullish bias — Minor tilt to the upside, but not extreme. No sign of aggressive positioning yet.
🟢 Option Suggestion (Monday through Wednesday):
* If AMZN reclaims and holds above $225, consider:
* Buy CALL debit spread (225c/230c Jul 3 or Jul 5 expiry)
* Targets: $227.50 → $230 (GEX9 + 3rd Call Wall zone)
* Stop: Below $222 or if $225 fails again
* If AMZN fails $222.50 and breaks $220:
* Buy PUT (220p or 217.5p Jul 3 expiry)
* Target: $215 → $211 (structure & OB zone)
* Stop: If reclaim $223+ with volume
Intraday Trading Analysis (1H chart structure):
Price broke above $222 → BOS confirmed, then sharply rejected near $225 GEX resistance. Now sitting at a precarious area — right between CHoCH support and the GEX call wall.
📊 Key Intraday Zones for Monday:
* Resistance:
* $225 – GEX Call Wall + Supply zone
* $227.50 – Next impulse target if $225 flips cleanly
* Support:
* $220.49 – GEX8 (gamma support zone)
* $217.50 / $216.03 – Strong structural confluence
* $211.12 – Final defense before selloff accelerates
🧠 My Thoughts for Monday:
If AMZN gaps up into $225+ and holds, it could trigger gamma acceleration toward $230. However, if we see a rejection and price stays under $222.50, then watch for a flush to $217.50–$215 quickly.
Confluence favoring a "fade the pop" early if $225 resists. Volume Friday spiked heavily on rejection — could be distribution.
Intraday traders can:
* SHORT near $225 with stop above $226.50
* LONG scalp off $220 only if support confirms (e.g., bounce with volume, bullish 5m CHoCH)
* Expect volatility early due to IV crush & GEX flip zone.
Conclusion & Game Plan:
This is a critical GEX reversal zone. Price is pinned between $225 gamma resistance and $220–217.5 support. Wait for Monday's open — trade the confirmation, not the guess. Watch volume reaction at these levels.
Disclaimer:
This analysis is for educational purposes only and not financial advice. Please do your own due diligence and manage your risk accordingly.

Profit Raiders’ Guide to Conquering AMAZON Stock!Hello, Wealth Warriors! 🌟
Stock market adventurers, let’s embark on a thrilling quest to dominate AMAZON stock with our cunning Raider Trading Strategy! 🗡️📈 Fueled by razor-sharp technical analysis and robust fundamental insights, this plan targets high-reward zones while dodging market traps. Follow the long-entry map, aim for the golden profit zone, and stay vigilant for overbought signals, consolidation, or bearish ambushes that could shift the trend. 🐻🔍 Secure your gains and celebrate your victory! 🎉
Entry 📈
The treasure chest is wide open! 🏰 Seize the bullish momentum at the current price of $206.02—your adventure begins! For precision, set Buy Limit orders on a 15 or 30-minute chart for pullback entries, targeting a retest of recent highs ($206.69) or lows ($202.19).
Stop Loss 🛑
📍 Place your Raider Stop Loss at the recent swing low ($196.00) on a 4-hour chart for day trades. Adjust based on your risk tolerance, position size, and number of trades to stay in control. 🛡️
Target 🎯
Set your sights on $217.00 or exit early to lock in your profits! 💸 Refer to the finance card above for price trends.
Scalpers, Stay Sharp! 👀
Focus on quick long-side trades. Large accounts? Strike now! Smaller portfolios? Join swing traders for the raid. Use a trailing stop to safeguard your gains as the stock moves. 🧲💰
AMAZON Stock Market Insights 📊
AMAZON is charging bullish, driven by strong fundamentals. 📈 Dive into earnings reports, macroeconomic trends, geopolitical events, market sentiment, sector correlations, and future price projections for a complete view. As of May 28, 2025, at 12:04 AM EST (UTC-5), the stock’s momentum is supported by a market cap of $2.17 trillion and a year-to-date high of $242.52. Stay informed! 🔗
⚠️ Trading Alert: News & Risk Management 📰
Market-moving news can strike fast! Protect your gains:
Avoid opening trades during major news events.
Use trailing stops to secure profits and minimize losses. 🚫
Join the Raid! 💥
Support our battle plan—smash the Boost Button! 🚀 Let’s conquer the market with the Raider Trading Strategy and stack profits like true stock market legends. 💪🤝 Prepare for the next adventure, raiders! 🤑⚔️🎉

AMAZONAMZN needs some more upside before a pullback.
Disclosure: We are part of Trade Nation's Influencer program and receive a monthly fee for using their TradingView charts in our analysis.

Amazon further upside 10% if no bad newsAs of Friday, June 27, 2025, at 9:09:56 PM PDT, here's an analysis of AMZN:
Current Price & Performance:
Last Price: $223.30 (as of 4:00 PM ET on June 27, 2025)
Today's Change: Up $6.18 (2.85%)
Previous Close: $217.12
Today's Range: Not explicitly available for today's high/low, but recent trading has been within the range of $211.045 to $223.30.
52-Week Range: $144.05 - $228.88
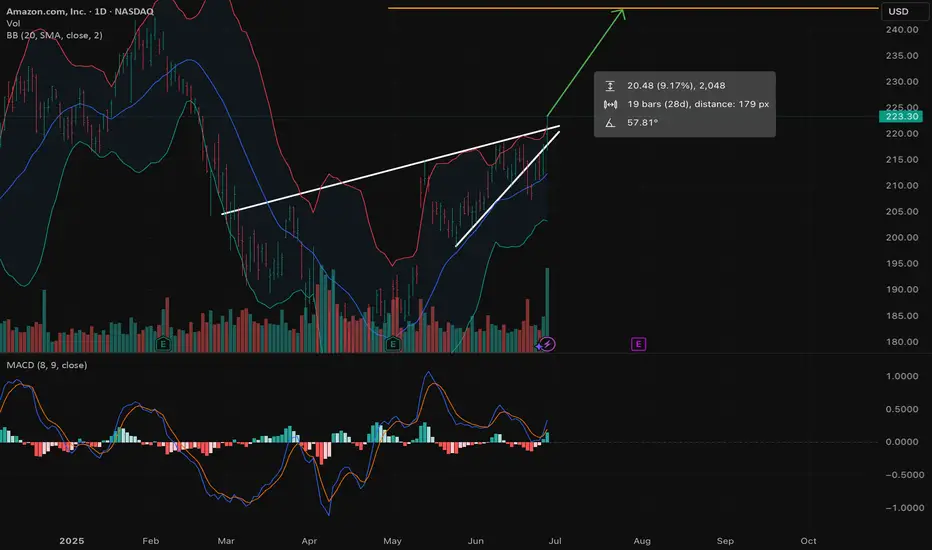
Bollinger Bands (21-Day Timeframe):
To apply Bollinger Bands correctly, we need three components:
21-Day Simple Moving Average (SMA): This is the middle band.
Upper Bollinger Band: 21-Day SMA + (2 * 21-Day Standard Deviation)
Lower Bollinger Band: 21-Day SMA - (2 * 21-Day Standard Deviation)
Based on available data (which provides a 20-day moving average, often a close proxy for 21-day in such analyses, and general band behavior):
21-Day Simple Moving Average (SMA) / Middle Band: The 20-day moving average is around $212.30. Assuming the 21-day SMA is very similar, this will be our median.
Current Price Position: Amazon's current price of $223.30 is above the 21-day SMA/middle band ($212.30).
Where are we - between the median and the upper band or lower band?
Given that the current price ($223.30) is significantly higher than the 21-day SMA/middle band ($212.30), and considering its recent upward momentum, it's highly likely that AMZN is currently trading between the median (21-day SMA) and the upper Bollinger Band.
Interpretation of Bollinger Bands for AMZN:
Price above the middle band: This generally suggests bullish momentum, indicating that the stock is performing stronger than its recent average.
Moving towards the upper band: When the price approaches or touches the upper band, it can sometimes signal that the stock is becoming overbought in the short term, potentially indicating a pullback or consolidation. However, in a strong uptrend, prices can "walk the band" along the upper limit for an extended period.
Bandwidth: While we don't have the exact standard deviation to calculate the precise upper and lower bands, the fact that the price is moving higher and staying above the middle band suggests that volatility might be increasing, and the bands could be expanding.
Recent News & Outlook:
Amazon recently surged by 6.75% in the five trading days ending June 8, 2025, reaching approximately $211.50 per share. (This was a few weeks ago, and the price has continued to climb since).
Analyst consensus targets are generally optimistic, with a median price target around $240.81.
Strong Q1 2025 results with significant revenue and net income growth underscore operational resilience.
Major investments in cloud infrastructure (AWS) and AI development continue to be key growth drivers.
The stock's upward movement is also being influenced by broader market optimism and positive developments like U.S.-China trade talks (from early June).
In summary, based on the 21-day timeframe and the current price action, AMZN is exhibiting strong bullish momentum and is trading within the upper half of its Bollinger Bands.
Important Considerations for Bollinger Bands:
Bollinger Bands are lagging indicators, meaning they reflect past price action.
They are best used in conjunction with other technical indicators and fundamental analysis.
"Walking the band" can occur during strong trends, so touching the upper band doesn't always immediately mean a reversal.
It's important to consider the overall trend and market context.
Remember, this analysis is for informational purposes only and not financial advice. Always conduct your own research and consult with a financial professional before making investment decisions.
$AMZN - $2128.20 break for move higher. Multiple catalystAMZN - Stock rejecting daily highs at $218.20 and rejecting it trice. Long and swing calls added in the group. July has been a good month for the stock. Prime day coming in the next 2 weeks. looking for more calls above $220 for a move towards $240 and higher

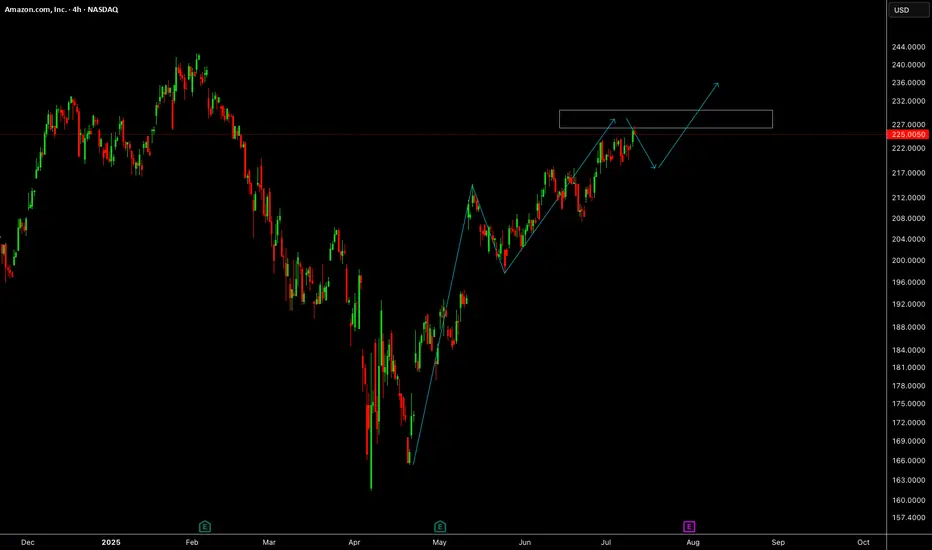
AMZN: Bullish Momentum Meets Critical Resistance - What's NextOverview:
After a significant downtrend from its early February highs (a move initiated after breaking down from the "Flip Zone" around 232−238), Amazon ( NASDAQ:AMZN ) found a strong bottom in late April. Since then, the stock has been in a well-defined uptrend, characterized by a consistent series of higher lows and higher highs.
Current Market Structure:
The price action is clearly respecting an ascending "Trendline Support" (the shaded teal channel), indicating underlying bullish strength. Each pullback has found buyers around this trendline or the identified support levels.
Key Levels to Watch:
Key Resistance 220 (Red Zone):
This is the most immediate and critical hurdle for AMZN.
The price has tested this level multiple times in recent weeks (late May and mid-June) and faced strong rejections, indicating significant selling pressure or profit-taking at this psychological and technical barrier.
A decisive break and sustained close above $220 would be a highly bullish signal, suggesting a continuation of the uptrend.
Intermediate Support 205 (Lower Teal Zone):
This level has proven to be reliable support during recent pullbacks (early June and late June).
It acts as a key pivot point; as long as price holds above $205, the bullish structure remains intact.
Flip Zone (232-238 - Upper Teal Zone):
This zone is crucial from a historical perspective. It acted as strong support in early February before the major breakdown. After breaking, it effectively "flipped" to resistance (as seen with the red circle showing a rejection).
If AMZN successfully breaks above the "Key Resistance 220," this "Flip Zone" will likely be the next major target for buyers and a potential area for sellers to emerge.
Disclaimer:
The information provided in this chart is for educational and informational purposes only and should not be considered as investment advice. Trading and investing involve substantial risk and are not suitable for every investor. You should carefully consider your financial situation and consult with a financial advisor before making any investment decisions. The creator of this chart does not guarantee any specific outcome or profit and is not responsible for any losses incurred as a result of using this information. Past performance is not indicative of future results. Use this information at your own risk. This chart has been created for my own improvement in Trading and Investment Analysis. Please do your own analysis before any investments.

AMZN Heating Up – GEX Shows There's Room to Run!
Alright, guys – here's the scoop on Amazon (AMZN) right now based on the latest GEX map and price action.
🧠 GEX Setup:
We’re seeing solid call gamma buildup from 213 → 220, and a strong positive NET GEX wall near 215–217. That tells us market makers might start pushing price toward those high-gamma zones to hedge, especially above 213. Gamma support kicks in from 210 down to 207, so bulls have a nice cushion below.
👉 IVR 7.1 is low, and calls flow is healthy at 4.2%, meaning option premiums are still pretty cheap – great time to consider buying options before a possible breakout push.
🎯 Options Strategy:
If you're looking to catch the upside gamma move:
* ✅ Buy CALLs around 213–215 strike
* 🎯 Target 217.5 or 220+
* ⛔ Stop below 210 or HVL zone
You want to be in before the gamma snowball effect starts pulling price up.
🧩 Price Action & Smart Money Structure:
The 1H chart is showing strong SMC structure:
* BOS confirmed ✅
* Higher low forming
* Choppy flag forming just under resistance — could break out soon
We have clear liquidity above 214–217 (old OB zone), so price may hunt that next. There’s a big imbalance left from the selloff — if we get a retest of the green OB at 210–211 and hold, that's your confirmation for a solid long entry.
📌 Trade Idea Summary:
* Bias: Bullish short-term
* Entry Zone: 211–213
* Target Zone: 217.5 → 220
* Stop: Below 208
* Option Play: Calls (1–2 DTE or next week)
If 213 holds and volume picks up, we could ride the gamma wave right into those high OI strikes. 🔥
Disclaimer: This is not financial advice. Just one trader’s view using GEX and smart money price action. Always manage risk and size appropriately.
