APA trade ideas

APA APA has been struggling financially for a while and has been trading in this downward channel just reaching the top border. Consistent rejections have been apparent especially as it approaches the 0.618 golden zone on our Fibonacci retracement.
Macro outlook there is a strong consensus that oil prices are going to see a decline continue for the rest of the year. The sheer supply of oil is already outstripping demand leading to storage of oil globally which is not only costly but has increased costs for companies. S/D analysts at goldman predict 4x in supply over the forthcoming year leading to lower oil prices.
APA will most likely struggle under these conditions, therefore im looking to sell

$APA: APA Corporation – Oil’s Wild Ride or Steady Bet?(1/9)
Good afternoon, everyone! ☀️
NASDAQ:APA : APA Corporation – Oil’s Wild Ride or Steady Bet?
With APA at $19.70, is this energy titan a fuel for profit or a risky barrel? Let’s drill down! 🔍
(2/9) – PRICE PERFORMANCE 📊
• Current Price: $ 19.70 as of Mar 17, 2025 💰
• Recent Move: Down from higher levels, reflecting oil price volatility 📏
• Sector Trend: Energy sector volatile amid economic uncertainties 🌟
It’s a rollercoaster—hold tight! ⚙️
(3/9) – MARKET POSITION 📈
• Market Cap: Approx $6.1B (310M shares outstanding) 🏆
• Operations: Oil and gas exploration in key regions like U.S., Egypt ⏰
• Trend: Vulnerable to oil price swings, but diversified operations offer stability 🎯
Firm in its niche, but subject to market winds! 🚀
(4/9) – KEY DEVELOPMENTS 🔑
• Oil Price Dynamics: Recent drops impact revenue and earnings 🌍
• Company Strategies: Focus on cost management and strategic investments 📋
• Market Reaction: Stock price reflects current market sentiments 💡
Navigating through turbulent waters! 💪
(5/9) – RISKS IN FOCUS ⚡
• Oil Price Volatility: Primary driver of performance 🔍
• Regulatory Changes: Environmental regulations and transition to renewables 📉
• Geopolitical Tensions: Impact on supply chains and prices ❄️
It’s a risky venture—stay alert! 🛑
(6/9) – SWOT: STRENGTHS 💪
• Established Presence: Key oil-producing regions like Permian Basin 🥇
• Diversified Portfolio: Operations across multiple geographies 📊
• Financial Stability: Strong balance sheet, per historical data 🔧
Got solid foundations! 🏦
(7/9) – SWOT: WEAKNESSES & OPPORTUNITIES ⚖️
• Weaknesses: Vulnerable to oil price drops, regulatory risks 📉
• Opportunities: Expansion into new markets, M&A activities, potential oil price rebound 📈
Can it weather the storm and shine again? 🤔
(8/9) – POLL TIME! 📢
APA at $19.70—your take? 🗳️
• Bullish: $25+ soon, oil prices rebound 🐂
• Neutral: Steady, risks and opportunities balance out ⚖️
• Bearish: $15 looms, further downturn ahead 🐻
Chime in below! 👇
(9/9) – FINAL TAKEAWAY 🎯
APA’s $19.70 price reflects current market challenges 📈, but its long-term potential remains. DCA-on-dips could be a strategy to average in over time. Gem or bust?

Bullish Double Bottom Reversal on APA Corporation (APA)APA Corporation (APA) is showing signs of a potential trend reversal with a Double Bottom pattern forming on the daily chart. The price has bounced off key support, and a breakout above the confirmation level could trigger upside momentum.
🔵 Entry: Confirmation breakout
🔴 Stop Loss: 18.42 (below the double bottom)
✅ Target: 31.00 (measured move projection)
With increasing volume, a breakout could signal a strong recovery. Traders should watch for confirmation before entering long positions.

Outbreak ConfirmedWith a second big candle we have exceeded the trading range which had lasted since the beginning of November. At the same time we have crossed both the exponential and the simple moving averages. This week has opened higher what can be seen as a confirmation of the outbreak.
Here we are struggling but the long way down in mind we may have hope that there will be another corrective wave up.

APA - Wave 3 Ahead?Standing out recently for not participating along with other oil stocks moving higher, APA has the potential to triple should the wave 3 unfold as illustrated. I've been building a position at this level.

APA Corp.- did we just acquire and find a hidden gem?Hi, dear followers up next we would follow up a company which is being overlooked and it can turn into a very lovely hidden gem.
Currently APA Corporation, has received a few lower targets by big Investment Analysts , but at the same time the company seems to deliver, since 2019 they have had a stable up trend, and throughout their Earnings Reports they have showed a good steady growth, the main focus here would be the good EPS results but more specifically the magnificent P/E Ratio that the company is showing at the level of 3.22. Currently we are formulating and trying to fit in a good ascending channel which should take us to the strong Resistance Level at - 51.24
Entry 24.26
Target 1 : 31.36
Target 2 : 39.62
Target 3 : 49.10
Follow up with this hidden gem and keep it in your portfolio for the next 3-9 months, and this fine gem might just turn out to be a diamond!
P.S. Follow up in my channel where we dive deeper in it's analysis


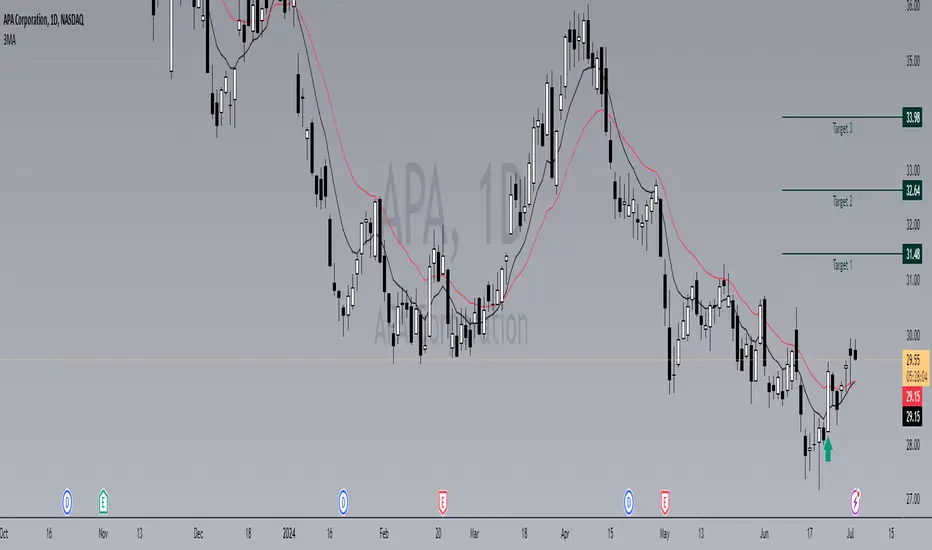
APA Corporation buys on the simulator at the breakout of the tarBuy entry at 29.60 for APA Corporation, first target at 31.48, second at 32.64, and final target at 33.98.
APA Nuzzles Lows as Headwinds Afflict EnergyAPA is struggling, even as the broader market powers to new highs.
The first pattern on today’s chart is the 2023 low of $30.67. The oil and gas driller has spent much of this year near and below that old level. It’s also made incrementally lower lows. That may suggest support is breaking.
Second, the 50-day simple moving average (SMA) had a “death cross” under the 200-day SMA in December. The 100-day SMA followed in January. Now the 50-day SMA has crossed back under the 100-day SMA. Those events may confirm a bearish trend is forming over the longer term.
Third, this chart includes our 2 MA Ratio custom script in the lower study. It shows the 8-day exponential moving average (EMA) has spent almost two months below the 21-day EMA. That may suggest the shorter-term trend has also gotten more bearish.
Finally, the bigger picture may be less favorable as demand weakens and inventories increase – especially for gasoline. TradeStation data also shows that energy is the worst-performing sector in the last month.
TradeStation has, for decades, advanced the trading industry, providing access to stocks, options and futures. See our Overview for more.
Past performance, whether actual or indicated by historical tests of strategies, is no guarantee of future performance or success. There is a possibility that you may sustain a loss equal to or greater than your entire investment regardless of which asset class you trade (equities, options or futures); therefore, you should not invest or risk money that you cannot afford to lose. Online trading is not suitable for all investors. View the document titled Characteristics and Risks of Standardized Options at www.TradeStation.com . Before trading any asset class, customers must read the relevant risk disclosure statements on www.TradeStation.com . System access and trade placement and execution may be delayed or fail due to market volatility and volume, quote delays, system and software errors, Internet traffic, outages and other factors.
Securities and futures trading is offered to self-directed customers by TradeStation Securities, Inc., a broker-dealer registered with the Securities and Exchange Commission and a futures commission merchant licensed with the Commodity Futures Trading Commission). TradeStation Securities is a member of the Financial Industry Regulatory Authority, the National Futures Association, and a number of exchanges.
TradeStation Securities, Inc. and TradeStation Technologies, Inc. are each wholly owned subsidiaries of TradeStation Group, Inc., both operating, and providing products and services, under the TradeStation brand and trademark. When applying for, or purchasing, accounts, subscriptions, products and services, it is important that you know which company you will be dealing with. Visit www.TradeStation.com for further important information explaining what this means.

Stocks pairs trading: APA vs TROWLet's examine the trade potential for APA Corporation (APA) and T. Rowe Price (TROW) by analyzing their key financial metrics and recent performance to determine reasons for going long on APA and short on TROW.
Price-to-Earnings (P/E) Ratio:
APA: P/E ratio of 3.29
TROW: P/E ratio of 14.03
APA's significantly lower P/E ratio indicates it is trading at a cheaper valuation relative to its earnings compared to TROW. This could suggest that APA is undervalued and has more room for price appreciation.
Forward P/E Ratio:
APA: Forward P/E of 6.11
TROW: Forward P/E of 13.51
APA's forward P/E is also lower than TROW’s, reinforcing the idea that APA might be more attractively valued based on future earnings expectations.
Return on Equity (ROE):
APA: ROE of 179.94%
TROW: ROE of 20.09%
APA's exceptionally high ROE indicates effective management in generating profits from equity, which is a positive sign for potential investors.
Strategic Acquisitions and Financial Performance:
APA recently completed its acquisition of Callon Petroleum, which is expected to enhance its operational footprint and synergies in the Permian Basin. This move follows a series of strategic acquisitions by major energy players, highlighting APA's proactive approach to growth.
Dividend and Analyst Outlook:
APA declared a regular dividend, maintaining a yield of over 3%, which is attractive for income-focused investors. Additionally, analysts have set a price target of $41.90, suggesting a significant upside from its current price around $29.36.
Decision:
Long on 4 APA:
Short on 1 TROW:

APA - Bullish My bias for the bigger picture (monthly) is bearish, however there is opportunity at these areas to take some profits to the upside, and sell before price reaches major resistance areas.
This trade might take a couple of months to play out.
Not financial advice.

APA Ready to MoveWhile the price of oil and other oil stocks have been on the move higher, APA has dignificantly lagged. Wave count indicates that the correction is over and higher prices ahead. Wave 3 projection shows prices exceeding 100 at 1.618% reading.


#APA# Energy dynamics will boost share prices.APA Corp. engages in oil and natural gas exploration through its subsidiary companies. The company operates in the United States, Egypt, and the United Kingdom, with offshore exploration activities in Suriname. Established in 1954, APA Corp. is headquartered in Houston, Texas.
The primary rationale for recommending this stock lies in the current tense geopolitical situation, which has led to an increase in energy demand. As we approach the year-end, the energy sector is emerging as a clear choice for investors. Geopolitical tensions in the Middle East have directly contributed to a resurgence in oil prices. Additionally, gloomy macroeconomic prospects have intensified concerns about global demand. Furthermore, the United States has tightened sanctions on Russian crude oil exports (link), exacerbating the already strained market supply concerns. Global inventories are expected to decline in the fourth quarter, which is likely to drive energy prices even higher, benefiting a range of related companies.
From a financial perspective, APA Corp.'s Q2 2023 financial statements show an improvement in net income compared to Q1. The company's previous quarter's earnings were $0.85 per share, exceeding the estimated $0.75 per share, representing a 13.53% surprise. Although the estimated figure for Q3 is $1.74 billion USD, the company's revenue for the same period is $1.96 billion USD. The next quarter's estimated earnings are $1.19 per share, with anticipated revenue reaching $2.01 billion USD, indicating a stable financial performance. This stability aligns with the core investment philosophy of maintaining a steady course towards the end of the year, leveraging the trends resulting from the geopolitical landscape, much like the benefits accrued during the previous AI boom.
Furthermore, APA Corp. has been recognized by FORTUNE magazine as one of the World’s Most Admired Companies for a fifth time, ranking fifth among international energy exploration companies, a testament to its operational excellence and reputation in the industry.
From a technical standpoint, APA Corp. is currently positioned at the breakout point of a descending wedge. On the daily chart, the RSI indicator has hit a bottom and is showing clear signs of a reversal pattern. In the MACD indicator, the $39 level marks a golden cross price point, while the Alligator indicator is beginning to contract upwards, signifying that the previous downtrend is nearing its end. The Fibonacci retracement at the 38.2% level offers significant support, and the stock is currently at the short-term resistance of 78.6%. The optimal entry point is around $40, which is also the key support level at 61.80%. The short-term first target is $55.53, with the second target at $85.40, and the third target in the vicinity of $95.12.
Trading Recommendations:
Entry Price: $34 to $44
T1: $55.53
T2: $85.40
T3: $95.12
Stop Loss: $30.70

Possible long positionIf the estimates are correct regarding the earnings as of 01. Nov. we could see a breakout from key levels and the wedges forming on APA. This is purely based on earnings and technical analysis and the possible recession might change the outcome. I will be monitoring this stock closely and looking out for key levels in 41, 45, 49 and 51 dollars.

APA established new positionWaited until Jerome Powell had finished speaking before taking any trades today,
Started the day with a new position on APA.
The ong entry trade set up is as follows:
1. Directional indicator are moving in opposite directions at an angle (pref > 35 degrees)
2. Volume osciallator (Chakin money flow and On Balance) is increasing
3. Resistance based on higher timeframe. In this case I have set potential resistance at slightly above $35
(Note that this is a projection only and does not necessarily mean that the price is expected to test resistance)

APA long. Looks prime for another move up. 3:1 risk reward herEasy Risk reward here. 3:1 I like the wave count and targets with easy stop .

Hedged Options Strategy on APAOil is one of the few sectors that analysts are still bullish on in 2023. Long arguments include catalysts such as China's re-opening, airlines recovering, and lowered supply leading to higher oil prices. APA Corporation, formerly known as Apache, operates in the US, Egypt and the UK and is one of the largest American explorers for oil and gas properties. It owns entire lines of production from gathering to transport with four pipelines running from the Permian to the Gulf Coast, as well as 2.3 billion barrels of oil reserves. Positive earnings reports exceeded expectations, and with a recent drop in stock price, this could be a good time to enter. Dividend stocks are popular in bearish times, and APA pays a consistent one, though not the highest at ~2.3%.
Elliot Wave traders will also note where APA is going in the pattern, though yesterday's doom-and-gloom market might make investors think twice about jumping in. For downside protection, this hedged options strategy could make up to 9% (17% annualized) in ~7 months while cushioning against a fall of up to 31% (to below $29.85) as of 7/21/23.
Buy 1 $42.50 call
Sell 1 $45 call
Sell 1 $30 put
7/21/23
Capital Required: $2985

APA - Long OpportunitiesTechnical Analysis:
- Price cross 20 MA and above, and is above 200 MA
- Stock is on an uptrend, with 20MA > 50 MA > 200 MA
- Price has been consolidating horizontally and the last bar was a strong rejection of the bearish bar before that (Oil and gas sector fell sharply on the day before)
- Volatility is high
- Stock seems to be in the early uptrend stage
Fundamental Analysis:
- APA is 97.3% undervalued based on discounted cash flow analysis
- Stable quality earnings growth of more than 500% over the past year
- Debt is well covered by operating cash flow
I have placed a buy stop at 47.5 for the next trading day.

APA - 1D - LongAPA is making HH and HL on a 1D time frame. We can see a weekly trendline and monthly resistance are giving tough times, which is a real challenge for now. If we combine the head and Should pattern + bullish divergence on RSI + Dow theory then it may cross this resistance soon then the target would be around 60.

APA - Rising MegaphoneA Megaphone structure with more bullish increases yet to come as indicated by the bars pattern
A megaphone like this could also be referred as a rising expanding wedge , but megaphone is the correct terminology
Bullish on this Monthly timeframe

US Stock In Play: $APA$APA - Energy | Oil & Gas
energy sector leads in RS over a 4wk period.
$APA outperformed among the S&P500 names from yesterday's market selloff with a double bottom price pattern from its correction in a 2-years uptrend. BO lvl coincides with confluence of VWAP & KMAs at $37.50
