Apogee Enterprises ($APOG): Set to Report Q3 Earnings As Apogee Enterprises, Inc. (NASDAQ: NASDAQ:APOG ) prepares to report its Q3 fiscal 2024 results on Friday, October 4, 2024, investors are closely watching the architectural products company for insights into its financial health and future growth trajectory. With strong investor sentiment in recent weeks and a solid performance year-to-date
Revenue Outlook and Recent Performance
In the previous quarter, Apogee (NASDAQ: NASDAQ:APOG ) reported revenues of $331.5 million, marking a year-on-year decline of 8.3%. Despite this drop, the company exceeded analysts’ earnings estimates, signaling operational efficiency and cost management amidst a challenging macroeconomic environment.
For this quarter, analysts expect a 5.1% year-on-year revenue decline, projecting sales of $335.6 million, which aligns with the company's performance trends. Apogee has struggled with revenue growth, missing Wall Street estimates three times over the last two years. However, these challenges haven't diminished investor confidence, as the stock has risen 9.2% in the last month, outperforming the 5.6% average rise among its peers in the building products sector.
Earnings Projections
Adjusted earnings for Q3 are forecasted to come in at $1.23 per share, reflecting analysts' expectations that the company will maintain profitability despite revenue headwinds. Given Apogee's history of beating earnings expectations, there is cautious optimism among analysts, many of whom have maintained their estimates over the past 30 days.
Dividend Payout
In addition to earnings, Apogee's Board of Directors declared a quarterly cash dividend of $0.25 per share, payable on November 6, 2024. This dividend, for shareholders of record as of October 22, 2024, reflects Apogee’s commitment to returning value to investors, even as the company navigates revenue challenges.
Technical Analysis: Key Levels to Watch
Rising Trend and Moving Averages
Since the start of 2024, NASDAQ:APOG stock has been following a rising trend pattern, consistently trading above key moving averages. This suggests that the stock has maintained momentum and upward strength, which is favorable heading into the Q3 earnings announcement.
As of Friday morning, NASDAQ:APOG stock is up 0.47% in premarket trading, continuing its upward trajectory. The RSI stands at 55.99, signaling moderate momentum with room for further gains. This level suggests the stock is not yet overbought, offering potential for a continued upward move, especially if earnings beat expectations.
Support and Resistance Levels
Immediate Resistance is found at $73, a critical pivot point. A breakout above this level could ignite a bullish campaign for the stock, particularly as investors digest the Q3 results and forward guidance. On the upside, the stock faces Support at $67.50 which coincides with the May 11th high, the average analyst price target. Should Apogee (NASDAQ: NASDAQ:APOG ) exceed earnings expectations, a breach of this resistance could lead to further buying interest.
Investor Sentiment and Peer Comparison
The broader building products segment has experienced positive investor sentiment over the last month, with stocks in the sector seeing gains of 5.6% on average. Apogee (NASDAQ: NASDAQ:APOG ) , outperforming its peers with a 9.2% increase, has been a standout in the sector, indicating strong market confidence in the company’s ability to weather short-term challenges.
This earnings season, Apogee (NASDAQ: NASDAQ:APOG ) is the first among its peers to report, so its results will set the tone for other companies in the building products space. Investors will be keen to see how Apogee navigates its revenue challenges and whether the company can maintain its earnings growth trajectory.
Conclusion: What to Watch For in NASDAQ:APOG
As Apogee prepares to announce its Q3 results, investors should watch for key developments:
- Revenue and earnings performance: Can the company meet or exceed analyst expectations?
- Guidance for future quarters: Will the company provide insights into how it plans to tackle declining revenues?
- Price action at key levels: A breakout above $73 could signal a bullish run, while a pullback could lead to retesting of support levels.
With a rising trend and positive investor sentiment, NASDAQ:APOG remains a stock to watch closely, particularly as its Q3 earnings could provide the next catalyst for movement. Long-term investors will be eyeing the company’s ability to continue delivering value through dividends and earnings growth.
APOG trade ideas

APOG bullish trendAPOG is a fundamentally strong stock and entries should be made after double top is broken out and it closes above 75
Stop loss should be 58 and ride the bull trend wave

APOG tripple topAPOG tripple top at 67
Entry should be made at 70 for a breakout or if one wants to be safe then enter when APOG close above 70 on daily time frame
Stop loss at 57
TP no need its a fundamenally strong company
buy it to keep for next 3 years at least

APOG - Move to Top of ChannelI expect the middle of the bigger channel to hodl and price to move up towards the top of this channel.
The smaller channel is at a sharper angle and shows how price may move up.
Bars pattern shows my thoughts.

Apogee Enterprises Declares Quarterly Cash Dividend and AnnounceAPOG: Apogee Enterprises, Inc.
2021-10-07 06:30:00
Apogee Enterprises Declares Quarterly Cash Dividend and Announces Increased Share Repurchase Authorization


Apog graph check. 6/4/2020Hi guys. im betting about 1k on options on this stock prayer to the lordy it goes up.
$Technical indicators.
I just drew a pretty graph and hopefuly this is how it turns out!
yolo!
25 call 6/19

APOG Tech AnalysisBulls
Need to clear 22 for shot at 30
Breach of 30 could open up 45
Bears
Need to hold 22 for shot at 15
Breach of 15 could open up 8
Rangers
Need to hold 22
Need to hold 15

super nova about to blast just use your eyes bro
load after drop from 30.60 to 33 is time to study kids big gap for 35 40 past patter show big bounces every time drop


Potential Position Formation - Daily Interval - APOGHello Successful Traders,
The stock (APOG) appears to be gathering momentum for a temporary pullback (bearish) within the up coming days (and weeks). The Overall PA (Price Action) of the stock is arguably entering a negative trajectory and could attest all time lows within the future. (Await Confirmation Prior To Entry). Always allow price action to dictate price, not emotion. (unless one is unconsciously adept).
Resistance Level 1 - (50.60 - 50.85) 25 cent interval
Key Price Zone - (39.30 - 39.60) 30 cent interval
Support Level 1 - (25.45 - 25.70) 25 cent interval
Not Investment Advice. For Educational and Analytical Purposes Only. (Be Conscientious and Stick To Your Trading Plan)***
-LionGate

APOG Increases Share Repurchase AuthorizatioAPOG: Apogee Enterprises, Inc.
2018-10-03 07:05:00
Apogee Enterprises Declares Quarterly Cash Dividend and Increases Share Repurchase Authorizatio

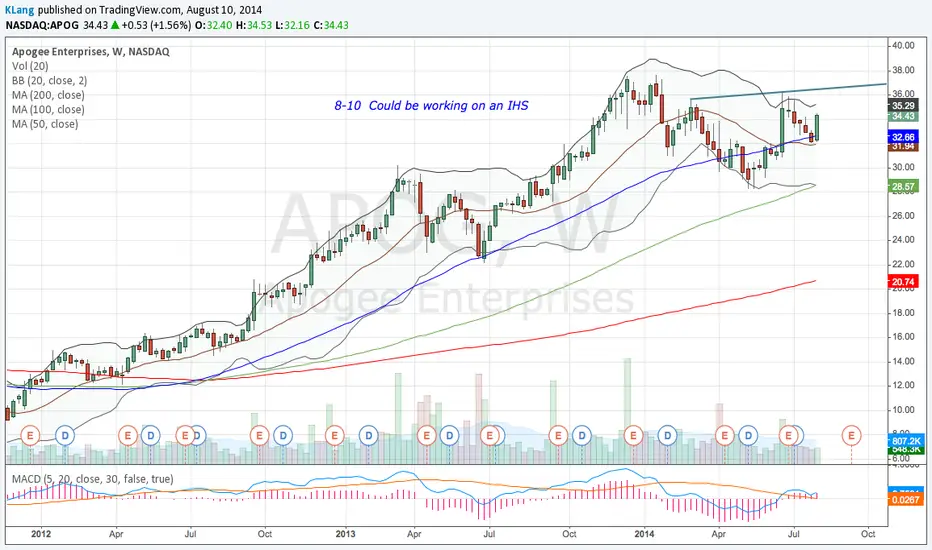
Is Apogee Enterprises (APOG) becoming a value play?Apogee Enterprises, Inc. (APOG) shares are trading at $42.82, down 11%. The share price fell because the company guided lower for the full fiscal year FY19. What's APOG stock price forecast--and what should investors know about the stock?
Apogee Enterprises manufactures and installs architectural glass and metal glass framings. It reports in four segments: architectural framing systems, architectural glass, architectural services, and large-scale optical technologies.
Apogee's revised revenue growth for the full FY19 is 8-10%, down from 10% previously. The new operating margin guidance is 8.3-8.8%, down from 8.9-9.4%...
www.finstead.com

APOG: Keep an eye on this for a big pop after earnings.Will break this year long trend and should go as high as 47.50ish.

#APOG #stock #shortThis stock has multiple bearish formation across multiple time frames. Indicators uniformity point down. Price target supports a 2 RRR. I would shut for the November 2018 put, strike price $40 for price between 3.70 3.90. That is a 20 cent spread. If stock hits target the strike price will be well above $3.90.
Daily
On the daily chart stock has formed a bearish descending triangle. all indicators point down.
Weekly
Stock has formed a H&S on the weekly chart. All indicators point down. There is a 2 RRR.
Monthly
Stock has formed a double top on the monthly chart. All indicators point down.

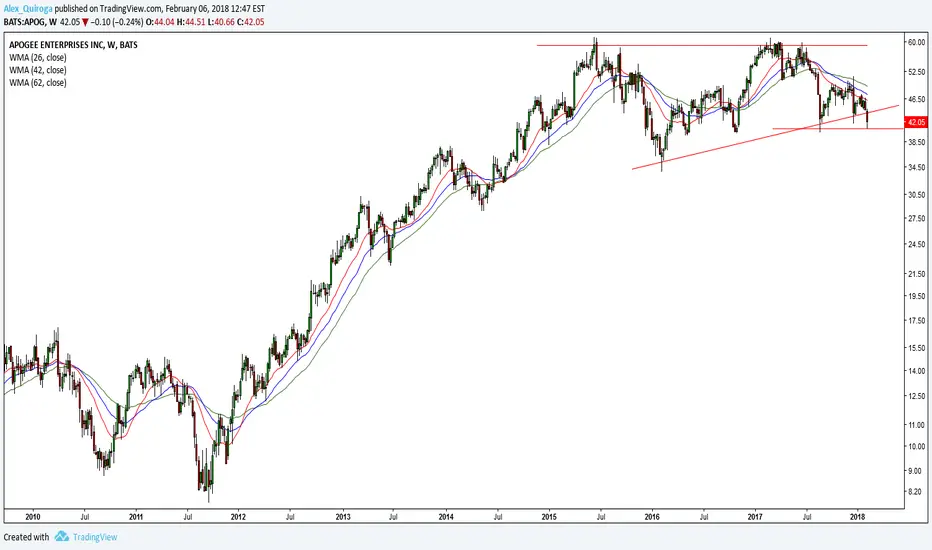
Dow drops 1,175 points :( #14 APOG)A double top with a trend line breakout and now the price it is negotiation with a horizontal support in the 40.00 level, wait for a breakout with a pullback.
This idea is for swing trading.
Targets are set based in the criteria of the traders

Apogee is heading back to the resistance lineAPOG bounced off its support trendline and is heading back towards its red resistance line. There is also a potential ascending triangle pattern that could lift the share price up even higher.


APOGNo edge here for me, notes on chart with target ideas depending if price finds or breaks support,
