WARZONE - Activision Blizzard keeps rising 🎮🖱️Might be the fact that I also spend some money for my gaming, or that it is my son's favorite stock.
or whatever reason, this stock is a keep and a buy.
Fancy a game of Call Of Duty Warzone?
add me here: KaraGUN1s#2867
Bring it ON gamers.
ps. I am 44 but I do play a few times a week with my friends on Discord.. I am the youngest one in that group
ATVI trade ideas

Activision showing strength for a swing trade towards Earnings$ATVI BULLISH
. prices is above the POC (point of control) in tis Volume profile
. BUY signals flashed on the CJ Stock Indicator
, modified golden-cross
. if it reaches .500 FIBO retracement and stays above it, has the potential for breakout.
. watching for relative volume to increase in it's Feb 4th earnings runup
Happy Trading, from CJ -- aka the greatest FURU.
To find out more about The Ultimate Stock Indicator on Tradingview, please check my public profile and schedule a Zoom.

ATVI - January 31, 2021ATVI has a 390 million monthly active userbase and recently launched Call of Duty BlackOps Cold war. The company is forecasting a strong Q4 with a $2.7B revenue holiday quarter, up from $1.7B last quarter and reports earnings this Thursday AMC. This is because new consoles have been released and PC gaming continues to grow. It is also likely that the new Call of Duty game is gifted over the holiday season. ATVI has been straight up since we called it out back in November, and are expecting a hold of this trend and push back to 95 on a strong run up this week.

$ATVI Hourly bull Flag 01/24/21Indicators look decent for next week. The gap below might fill if the general market aims lower. So long as the stop at the red line is not hit, ATVI should reset and continue above.

Activision Blizzard: middle term bullish
Activision Blizzard is bullish in the mid term with a 110$ goal. But be careful in the short term. The stock has done a RSI besrish divergence so I expect that the stock can drop to lower levels in the short term. But hopefully, the stock has a bullish trend that may accomplish in the mid term to achieve 110$

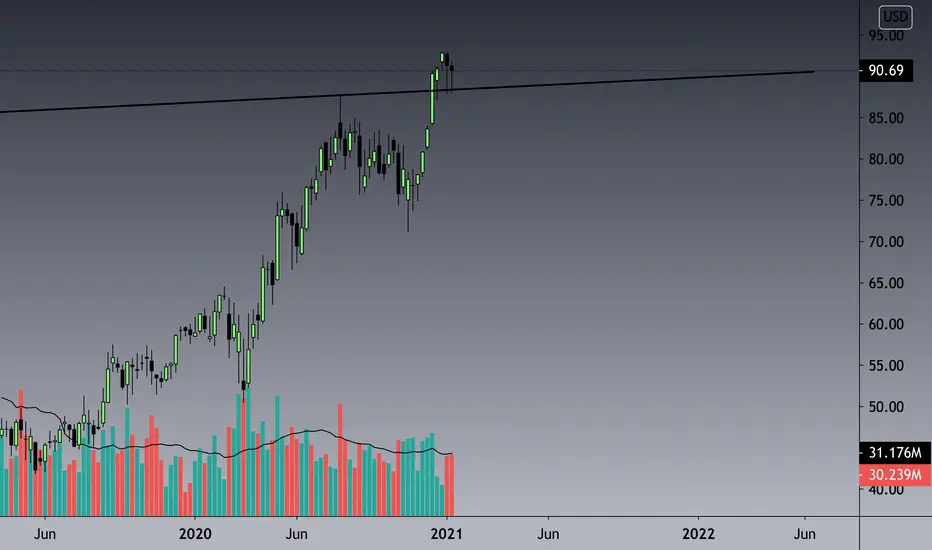
Bullish breakout on a good volume for Activision Blizzard (ATVI)By looking at the daily chart, we can see the strong bullish rally that has occurred in the period March-August taking the price from the March 17th lows of around $51 to the $87 all-time highs in the beginning of August. Since then, we have seen a very common trend continuation pattern consisting of an initial strong volatile correction, which is then followed by a sideways price action with a slight downward corrective bias. This creates a diagonal downward sloping resistance line following the corrective movement, which if broken to the upside signals the resumption of the long-term trend. Once again this famous chart pattern proved to be accurate in the prediction of the next big move in the market as the $80 resistance was broken to the upside in the beginning of December. What followed was an incredible and rapid rise of the stock all the way up to the $93 mark, thus recording a new all-time high reading. The stock was sitting at the $89 mark at the end of last week after being initially rejected by the $93 highs. However, we have seen a strong push higher through the former all-time highs as the stock is currently sitting at $95 per share.
We believe that the initial short-term corrective movement was provoked by nothing else but a short-term profit taking interest in the market. The prior all-time highs back from the August bull-run are providing immediate support around the $88 level. While we believe that the stock market in the US is currently holding a lot of intrinsic risks surrounding COVID-19, the transition of power in the White House, the economic recovery etc. and that we could be in for a sideways and choppy price action in the coming weeks, which in turn could affect a lot of the stocks negatively, we see that the winners will most likely continue to win. We remain bullish on the ATVI stock and believe that all these profit-taking corrections are giving us great opportunities to buy the stock at a good discount, which would in turn give us a chance to maximize our profits to the upside. Moreover, some of the technical indicators that we are monitoring closely (50 DMA, 100 DMA, Bollinger Bands, RSI etc.) have already retraced from extreme overbought conditions are currently trying to build up some momentum for another push higher, which means that the uptrend might be resuming very soon.
The daily chart shows that the price found lots of buying interest at the first key horizontal support line around $88, which is actually further supported by the strong dynamic 20 DMA support sitting at $89. Considering the fact that new all-time highs were set recently we should see the price staying above the prior ATH and treat it as a support in order for the strong rally to continue. Furthermore, we have the critical 50 DMA and 100 DMA currently lying at the $83 and $85 marks, which will definitely provide remarkable technical support for the price in case $89 gives away. We expect lots of buying pressure to occur around the above-mentioned support levels, which in turn will end up sending the price back towards the round number at $100. Our extended Take Profit level will be placed at $108.50
Follow us @dowexperts


Breaking out? Yes! a nice set up break out. You're welcome.
Any comments? please leave below. GL trading!

CUP & HANDLE ON ACTIVISION a confirmed cup and handle pattern can be seen on this market, we can use the depth of the handle and a conservative tp and the cup for full tp

$ATVI | Activision Blizzard Bull Flag Continuation [Update]ATVI broke out of the previous all time highs and has retested the horizontal structure. Watch for continuation to the upside.


#Atvi Long??!!Atvi looking amzing for the long its currently ins bullish triangle that can break down but i see it making a lower low before breaking down to complete E, for a potential upside it also has a monthly trendline that it wants to retest for a possible hard bounce!

ATVI road to $100 first stop $92.93ATVI broke the monthly trendline since IPO ($88.55). I would ove one last tap to $88.55 before I start to scale in. It should have an er run up as well. Pennant looks nice. either wait for a tap at $88.55 or scale in once it breaks above $90.82 NASDAQ:ATVI
^ Monthly and Weekly chart posted.


my long term wish that it will go to 200 who knows ...
but i think its a good industry during a long pandemic ..
what else do you do besides netflix ?

👀🚨SUNDAY OPTIONS WATCHLIST 1/10/21🚨👀ATVI - Great set up for a swing on this one. Recently broke previous highs (87.73) and has now tested as support twice and held and looks strong to continue. Could see more consolidation so buying time is smart. Will be looking at entering a swing with a 95 C with PT of 95-100.


Cup and a handle confirmed a 2 year consolidation pattern for this game company.
I think its ready to go to new places with this Covid 19 and the release of diablo 3

ATVI inside day after all time highIt's obvious to find out that Blizzard is able to catch their players attention well recently,
and it reflects on it stock price significantly!
(Both Hearthstone and Call of Duty are killing my office's vibe lol.)
I would very love to long the inside day after new high today.
Let's see how it goes yo!

$ATVI to 100+ long term target!Loading Feb 100c which are very cheap
Beautiful cup and handle setup here
This is a long term growth stock and leader in the industry (Morgan Stanley) best pick for 2021.

