AYRO electric vehicles*investment opportunity*
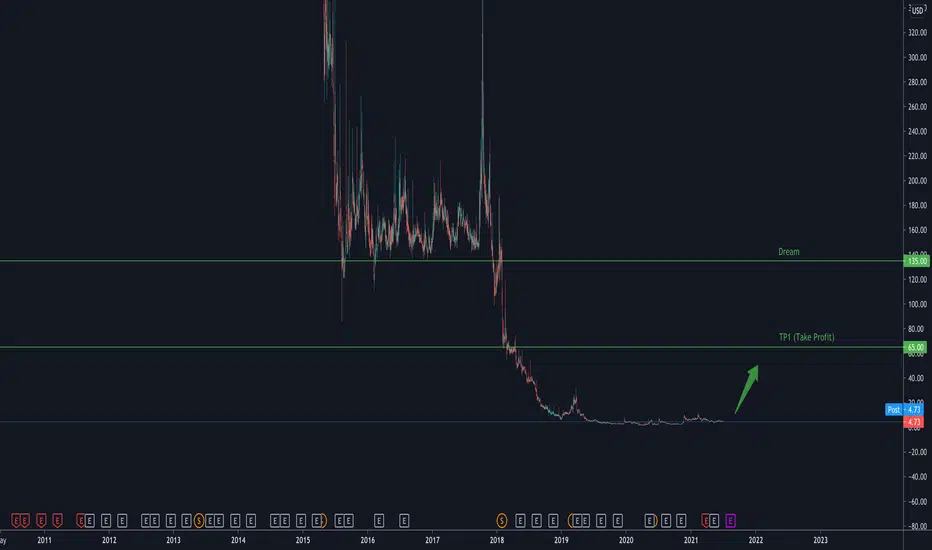
On the above monthly chart 7 years of price action resistance comes to an end following an oversold condition (orange column) with price action breakout. There now exists a number of reasons to be bullish on AYRO, they include:
1) Regular bullish divergence. Price action made lower lows as the oscillators made higher highs - very bullish.
2) Together with point (1) volume is accumulating. Someone knows something I don’t!
3) On the 6-month chart (below) there is a large ‘morning star’ candle with bullish engulfing candle confirmation. Very bullish on this scale making a trend reversal highly probable.
4) Lastly on the weekly chart (below) we have the 21-week (yellow) moving average crossing up the 50-week (Green) moving average. Been over 14 years since that happened.
Institutions such Blackrock, amongst others, make up for 3% of the shareholders of this stock.
A buy from $4.25 is excellent.
Weekly chart:
6-month chart:
AYRO trade ideas

$AYRO Potential Long Target -> $1.60$AYRO broke the resistance level at $1.10
It could run all the way to the next resistance level at $1.6 in the coming days

AYRO is gearing momentumAYRO started the day with heavy volume. Looks like it want's to come back. If daily close is below 1.08 we can scrap the trade.

AYRO prediction AYRO looking over sold here low risk since it's so bottomed out. Taking it for a swing...


AYRO - D :: Possibility of a Recovery is RealStill, with Covid-19 cases fading and gradually declining, the possibility of a recovery is real. So if you really want to play, AYRO could be your ticket.
Ayro Possible inverse Head & Shoulders detected within a C&HNASDAQ:AYRO has a lot of potential as an American Company focussing on a niche. Now everything starts opening up post Corona era, it should be able to sign contracts and start delivering their EVs.
Also at February 11th they had entered into definitive agreements with several institutional and accredited investors for the purchase and sale of 4,400,001 shares of the Company’s common stock, at a purchase price of $9.50 per share, in a registered direct offering priced at-the-market under Nasdaq rules. In addition, the Company granted to the investors in the offering the right to acquire an aggregate of 3,300,001 shares of the Company’s common stock at a purchase price of $11.50 per share until the one-year anniversary of the closing date of the offering. The closing of the offering is expected to occur on or about February 16, 2021, subject to the satisfaction of customary closing conditions.
The gross proceeds to the Company from this offering are expected to be approximately $41,800,000, before deducting financial advisory fees and other offering expenses payable by the Company. The Company intends to use the net proceeds from this offering for working capital and general corporate purposes.


6/18 $5 Call AYROPossible reversal in trading channel
Enry at long signal or breakthrough entry point
especially if MACD breaks zero
goal is target 1
watch for reversal if going for target 2
NASDAQ:AYRO


$AYRO Inc Levels of Interest. Hopefully you find the chart helpful in terms of Supports & Resistance etc.
we refrain from adding commentary on the chart as that is reserved for our members and we are very conscious of not giving financial or trading advice.
Thank you for taking time to consult our chart and we would really appreciate a like, follow or comment.


$AYRO last chance to hold...About to touch my arch, could be the final test and push higher...or failure...I am leaning towards a rebounded starting the next few days


$AYRO it's about time again...It's been a little while, been watching and waiting. Starting to look again for the right play here...


AYRO, another EV play if you likeGreat potential on this stock when its still not picked up by the big players, 2nd time into ayro. check out our previous trade

$AYRO out for a little now...Road 1,000 shares from $5.30 average to $6.30, made some and will look for some options further out while I wait to see if there is resistance here

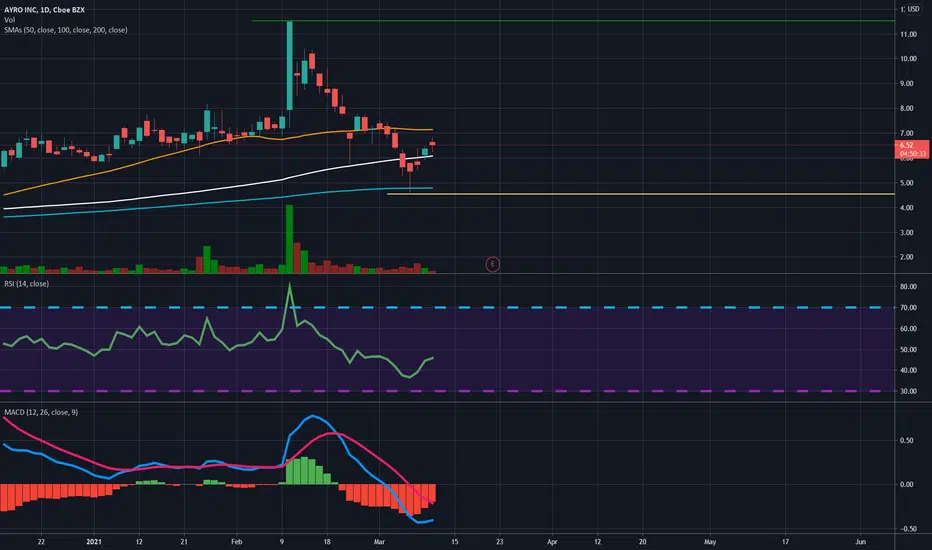
AYRO daily chart. Looking at the daily chart on AYRO you will see that the MACD is closing red and could be going green. RSI looks steady wanting to head up. Candlesticks is above the 100 sma line and will look for it to go back up the 50 sma line. Earnings coming up could be a catalyst to push the price up.