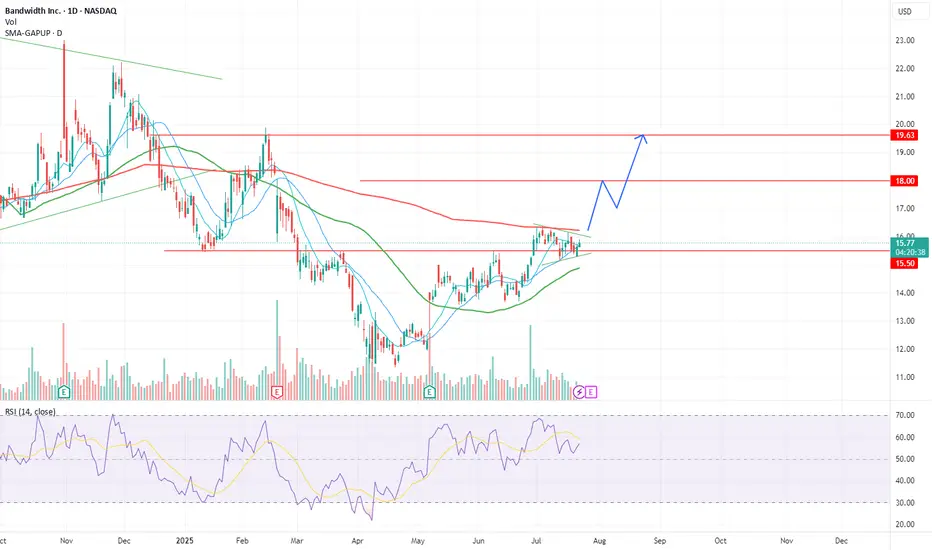
BAND is currently held by the 200 MANASDAQ:BAND is showing positive signs and may be ready to post some gains if it breaks above the 200 day moving average. Anticipated price action and targets are shown on the chart, stop loss daily close below 15.15$.
PS. My views only, not financial advice!
Next report date
—
Report period
—
EPS estimate
—
Revenue estimate
—
−0.03 USD
−6.52 M USD
748.49 M USD
27.11 M
About Bandwidth Inc.
Sector
Industry
CEO
David A. Morken
Website
Headquarters
Raleigh
Founded
2000
FIGI
BBG001K003W2
Bandwidth, Inc. engages in the provision of cloud communications software services. The firm is also involved in delivering experiences through voice calling, text messaging, and emergency services applications. The company was founded by Henry Kaestner and David A. Morken in July 2000 and is headquartered in Raleigh, NC.
Related stocks
One of My Favorite AI Plays Hasn't Gone Anywhere in 3 YearsSometimes, trading is boring. The same can be said for investing as well. I first got interested in Bandwidth when AI was starting to emerge about 2+ years ago. I found their approach and AI product interesting because they quickly started building voice at scale for AI products by providing the "pi

Bandwidth (BAND) - Watching the gapsThere's a saying that "gaps act as magnets" and that saying has always stuck with me. It's one reason why I always look for gaps on the chart to watch.
Bandwidth, ticker symbol BAND, is a company that provides cloud-based communications services for enterprises. I have written about them a few tim

My Favorite AI Play - Bandwidth (BAND)Bandwidth (BAND) is my favorite AI play right now.
The chart looks really bad! I get it. Today, it trades for below even its IPO price.
But the reason why I think it's an AI play ready to double, possibly triple, is a fundamental reason that I'll explain in this post.
First of all, let me state s

Hidden ResistanceBAND has risen sharply today but has reached a hidden resistance now. Thus I am expecting a correction downwards before it perhaps may rise again. Mind that we are within a bearish trend and we have not fallen through the previous low to trigger stoplosses.

Meet the worst performing industry in the bear marketThis chart shows RingCentral, Bandwidth, and Twilio. I have actually wrote about Twilio a few times because its sell-off has been especially pronounced.
In some respects, Twilio is one of the poster childs of the recent bear market mania among high flying tech names.
Nonetheless, not that I am a k

BAND I believe this stock is done as for now, unless some good news keep giving a good credibility for a continuation.

BANDWIDTH WILL POP SOON 30% UpsideAs shown in the chart above, using Fibonacci, Bullish Falling Wedge, RSI Divergence.

Bandwidth Bullish Breakout- RSI Divergence (blue arrow).
- Price at historical low.
- Wait for breakout above the resistance 21 USD to buy at Market.
Good luck.

BAND way oversold with gap to fill. Looking for a bounce to $40's, on valuation the stock is cheap here! seekingalpha.com

See all ideas
Summarizing what the indicators are suggesting.
Neutral
SellBuy
Strong sellStrong buy
Strong sellSellNeutralBuyStrong buy
Neutral
SellBuy
Strong sellStrong buy
Strong sellSellNeutralBuyStrong buy
Neutral
SellBuy
Strong sellStrong buy
Strong sellSellNeutralBuyStrong buy
An aggregate view of professional's ratings.
Neutral
SellBuy
Strong sellStrong buy
Strong sellSellNeutralBuyStrong buy
Neutral
SellBuy
Strong sellStrong buy
Strong sellSellNeutralBuyStrong buy
Neutral
SellBuy
Strong sellStrong buy
Strong sellSellNeutralBuyStrong buy
Displays a symbol's price movements over previous years to identify recurring trends.
BAND5142697
Bandwidth Inc. 0.25% 01-MAR-2026Yield to maturity
10.57%
Maturity date
Mar 1, 2026
BAND5392855
Bandwidth Inc. 0.5% 01-APR-2028Yield to maturity
7.48%
Maturity date
Apr 1, 2028
See all BAND bonds
Frequently Asked Questions
The current price of BAND is 14.99 USD — it has decreased by −0.99% in the past 24 hours. Watch Bandwidth Inc. stock price performance more closely on the chart.
Depending on the exchange, the stock ticker may vary. For instance, on NASDAQ exchange Bandwidth Inc. stocks are traded under the ticker BAND.
BAND stock has fallen by −6.25% compared to the previous week, the month change is a 2.25% rise, over the last year Bandwidth Inc. has showed a −29.06% decrease.
We've gathered analysts' opinions on Bandwidth Inc. future price: according to them, BAND price has a max estimate of 36.00 USD and a min estimate of 12.00 USD. Watch BAND chart and read a more detailed Bandwidth Inc. stock forecast: see what analysts think of Bandwidth Inc. and suggest that you do with its stocks.
BAND reached its all-time high on Oct 13, 2020 with the price of 198.61 USD, and its all-time low was 9.20 USD and was reached on Oct 14, 2022. View more price dynamics on BAND chart.
See other stocks reaching their highest and lowest prices.
See other stocks reaching their highest and lowest prices.
BAND stock is 4.37% volatile and has beta coefficient of 1.40. Track Bandwidth Inc. stock price on the chart and check out the list of the most volatile stocks — is Bandwidth Inc. there?
Today Bandwidth Inc. has the market capitalization of 446.15 M, it has decreased by −2.17% over the last week.
Yes, you can track Bandwidth Inc. financials in yearly and quarterly reports right on TradingView.
Bandwidth Inc. is going to release the next earnings report on Jul 29, 2025. Keep track of upcoming events with our Earnings Calendar.
BAND earnings for the last quarter are 0.36 USD per share, whereas the estimation was 0.27 USD resulting in a 33.24% surprise. The estimated earnings for the next quarter are 0.33 USD per share. See more details about Bandwidth Inc. earnings.
Bandwidth Inc. revenue for the last quarter amounts to 174.24 M USD, despite the estimated figure of 168.95 M USD. In the next quarter, revenue is expected to reach 178.87 M USD.
BAND net income for the last quarter is −3.74 M USD, while the quarter before that showed −1.76 M USD of net income which accounts for −112.62% change. Track more Bandwidth Inc. financial stats to get the full picture.
No, BAND doesn't pay any dividends to its shareholders. But don't worry, we've prepared a list of high-dividend stocks for you.
As of Jul 27, 2025, the company has 1.1 K employees. See our rating of the largest employees — is Bandwidth Inc. on this list?
EBITDA measures a company's operating performance, its growth signifies an improvement in the efficiency of a company. Bandwidth Inc. EBITDA is 37.37 M USD, and current EBITDA margin is 4.38%. See more stats in Bandwidth Inc. financial statements.
Like other stocks, BAND shares are traded on stock exchanges, e.g. Nasdaq, Nyse, Euronext, and the easiest way to buy them is through an online stock broker. To do this, you need to open an account and follow a broker's procedures, then start trading. You can trade Bandwidth Inc. stock right from TradingView charts — choose your broker and connect to your account.
Investing in stocks requires a comprehensive research: you should carefully study all the available data, e.g. company's financials, related news, and its technical analysis. So Bandwidth Inc. technincal analysis shows the sell today, and its 1 week rating is sell. Since market conditions are prone to changes, it's worth looking a bit further into the future — according to the 1 month rating Bandwidth Inc. stock shows the sell signal. See more of Bandwidth Inc. technicals for a more comprehensive analysis.
If you're still not sure, try looking for inspiration in our curated watchlists.
If you're still not sure, try looking for inspiration in our curated watchlists.