Baidu Inc Another Chinese tech stock. If it can clear and hold $191.40 then we may see push out of this tight consolidation.
Negative below 184.00
BIDU trade ideas

BIDUReally like how this is setting up. Should be a strong move either way it goes. Leaning bullish as long as $180 holds.


6/15 BIDUit's a weekly chart for BIDU
and I think the purple zone shall be good to entry
current MAs are flat which is not a bad thing


Will BIDU reverse Up?Am i seeing this correctly?
Some sort of reverse wedge on BIDU. Togtehr with strong RIS divergence is telling me to BUY bidu and take it LONG to the 61% FIB level.
$BIDU Descending wedge breakout ST/LT MA convergence$BIDU Unusual options activity. Descending wedge breakout approaching short-term and long-term convergence. Will be watching for a move to $220. Lot's of potential.

$BIDU Good Bottom Buy? 6/1-2Video Breakdown on $BIDU
Looking good potentially to the upside past 208-10

BIDU Looking WavyStrong bounce off a range it has interacted with frequently over the last decade, immediate reversal

BIDUmac d is green
rsi is approaching the top
previous was broken
looking for retracement up to 61% of previous high...
move happens by january?
what do you think?

Buy opportunity at $150. PT $480Buying zone between $219 (0.5 retracement) and $122.88 (0.854 retracement of the first impulse).
Looking at the RSI trajectory and the MACD bearish signal in the weekly we are likely to cross the 200 EMA to $147.35 (0.764 retracement), a zone that has been acting as support and resistance for the past few months.
Baidu closed the second retracement of the supercycle in March 2020. Currently consolidating the second wave of the third impulse, which will be the largest, with a target of between $483.5 (1.618 extension) and $562.88 (2 extension) if the bottom of the second wave is confirmed at $147.35.
In the event that the bottom of the second wave is at the 0.5 retracement (where we are now), targets would be between $458.37 (1.68) and $522.22 (2).
Overview :
First buy order (25% of the position) at $190.
Second buy order (75% of the position) at $150
Sell orders (depending on the last bottom): between $455 and $562 in the beginning of 2023.
+50% annualized profit .
Like and subscribe if you liked the idea and want more.
Comment with your opinions. Any idea is appreciated.
Manage risk properly and don't invest more than you can afford.

BIDU - $140s or $270s? I re-entered with a BIDU position few days ago, but I feel there's a possibility the weakness could continue.
I believe the stock should be able to hold it's $170s low next week, but based on time cycles it's weak zone continues next week until first week June. If that $170 support zone breaks due to any China related news or general market sell off, BIDU may be a crazy price to average in at $145 range (the yellow 500 MA)
Either ways, I feel BIDU is a good buy here if you're okay to hold your swing for a few months. My price target is for BIDU to retest at least $270 before end of 2021 (I expect this to happen more likely before September)
Good luck!

PT $483-$560 in Dec. 2022Starting the 3rd Wave of the second super cycle + macro cup&handle pattern indicates a PT between 483 and 560 in Dec. 2022.
Bullish perspective on this stock in the mid term and long term. The total addressable market value of Baidu's non-advertising business is 10x the size of online advertising.

Buy the dipThere's a lot that can be said about Baidu and its prospects going forward as well as its current valuation. Needless to say, the data that has come out as well as the analyst's ratings reports show that the prospective growth in earnings is comfortably towards the upside, supported by solid fundamentals. The signals on the weekly chart also look very promising.
Its a nice stock to own along side the likes of Alibaba which operate in the same space.
Please like and follow for daily posts on various asset classes. Please also share your views on the trading ideas and whether or not you find them to be of any value to you as a trader.
Please note, this idea is shared for educational and discussion purposes only and should not result in speculative investment decisions in any asset class.

$BIDU with a Bullish outlook following its earnings #Stocks The PEAD projected a Bullish outlook for $BIDU after a Positive over reaction following its earnings release placing the stock in drift B
If you would like to see the Drift for another stock please message us. Also click on the Like Button if this was useful and follow us or join us.


Falling wedge pattern formed with strong fundamentals for BIDUWith an earnings and revenue beat, Baidu is poised for a bearish upward trend once headwinds from delisting and clampdown from the Chinese government are decoupled from the company. Technical analysis shows Baidu trading are key Fibonacci levels and forming a falling wedge pattern.
Price Target:
Near term: 212.08, with a 60% confidence
Mid-term: 260.87, with a 50% confidence
Risks:
Bear flag wrongly recognized as a bearish falling wedge (somewhat likely)
Government clampdown (unknown)
Delisting (least likely)

Baidu (BIDU) Good Entry Point on W1.Baidu (BIDU),W1: Support line + Hammer + Hidden Divergence + Great sell off.


$BIDU Pre-Earnings Update! I have been playing $BIDU successfully for 3 weeks straight. Looking forward to seeing the stocks reaction to earnings!

Baidu - potentially one of the best 'value' stocks on the marketBaidu has been savaged 50% in just 58 sessions and as a CFD trader I would always recommend buying strength and selling weakness, we may be looking at an inflection point in the bear move. Consider George Soros just announced a sizeable $77m purchase of Baidu, buying the weakness in several the stocks that were sold down in the Archegos blow up. If it’s good enough for Soros…..!
The consensus 12-month price target from analysts is $338.08, which given the current price suggests some 81% upside. Then, consider that of the 44 analysts who cover, 38 have a ‘buy’ recommendation, a function of the expected return. To the fundamental crowd Baidu is considered incredibly ‘cheap’ on 14.9x 2022 earnings, especially when we contrast to other large-cap internet peers, who trade largely around 30x 2022 earnings. The market clearly ascribes limited value to its equity holding of Trip.com, Baidu cloud, DuerOS, or the future of autonomous driving solution.
Will the Q1 earnings (Tuesday 18 May) prove to be a catalyst that sees price move close to the fundamental value?
We shall see, but as always, as CFD traders, we tend not to focus on long-term ‘value’ and cut our craft reacting to price action. It does play into risk vs reward assessment though, and we understand that if the bullish catalysts are there and the street are this constructive, if they hear something that resonates that it may start attracting serious capital from funds.
Baidu also have an outstanding pedigree at quarterly results having beaten estimates both on earnings and revenue in seven of the past eight quarters. I would argue that the valuation cushion, and the recent artificial sell-down suggests the barrier to rally is low.
As a short-term trade – if price can push above $190 in the near-term we may see a re-test of the $220 neckline of the head and shoulders. This would likely be driven by better earnings. Conversely, we need to respect the trend and a closing break of $176.90 would see a resumption of the bear trend, suggesting short positions for $140 – possibly $120. The head and shoulders target resides at $100.

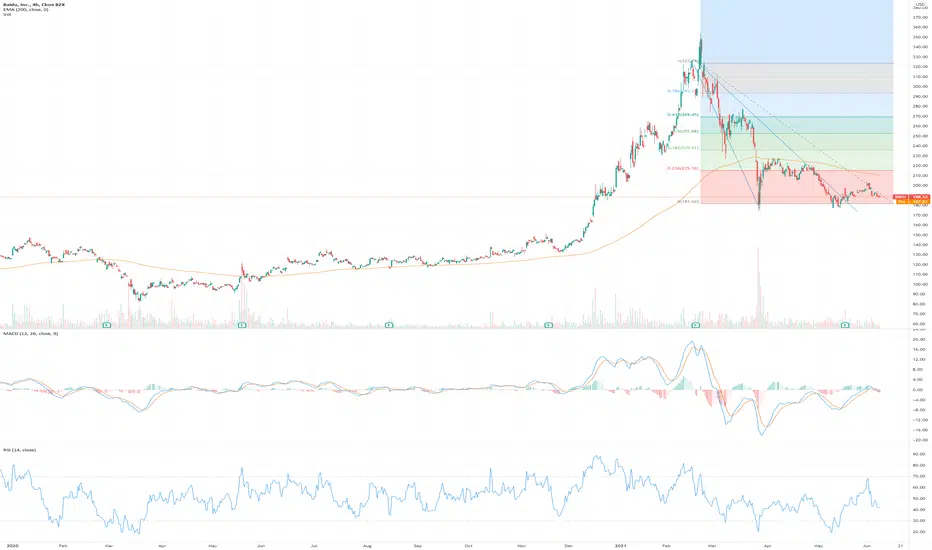
BIDU - good level to dip our toes inBIDU has retraced a good 61.8% of it's run since the covid crash (AB swing). This is also where we have a previous horizontal resistence zone turned support, around 180-186
There was an attempt to break below this zone (went as low at 174 but rebounded to 208) on the week of 22nd March. Last week, it made another attempt to break below before closing above the zone at 191.
Confluence of fib support, horizontal supports and bullish divergence between price and RSI is making this a compelling reason to stake.
It is probably going to be a slow turnaround and for a conservative entry, I will be staking only if it starts going above the previous week's candle high (> 191) with initial stop loss below 180.
Disclaimer: TA is about improving our odds of a successful trade, but there is no guarantee. This is just my own analysis and opinion for discussion and is not a trade advice. Kindly do your own due diligence and trade according to your own risk tolerance and don't forget that money management is important! Thank you. Feel free to le me have your comments! :)

Bearish Bidu for ERBIDU went up 80% after they announced EV news on Dec 30th. The have come down to the exact price of EV news and I think they will miss EPS estimates, prob beat revenue bc of ecommerce. I would say there valuation price target is in the $130-140's. The EV news is all speculation.
