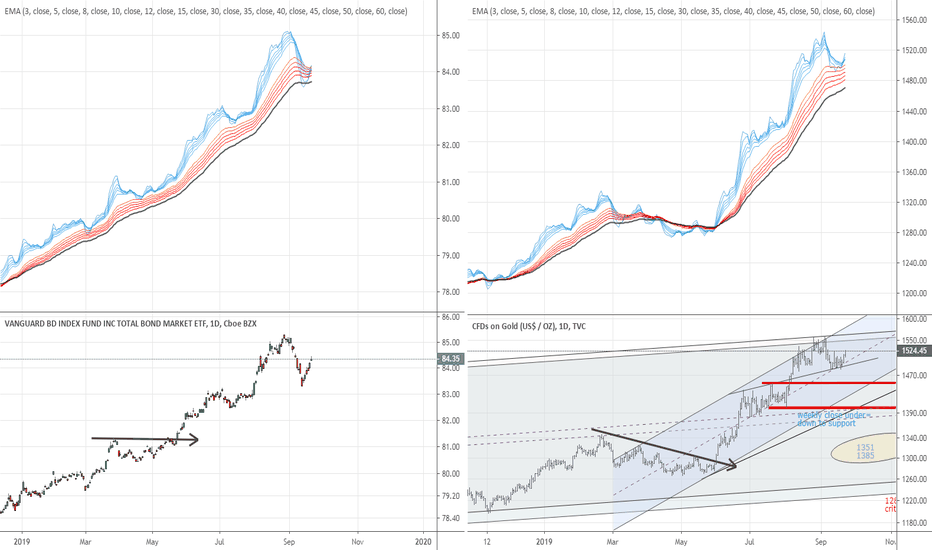
Beyond bond marketBuying the BND ETF (Vanguard Total Bond Market ETF) can be a smart move for several reasons, especially for those looking to diversify their portfolio, generate income, or manage risk. Here are some compelling reasons why you might consider buying BND:
1. Diversification
Broad Exposure to the Bond Market: BND gives you access to a wide variety of U.S. investment-grade bonds, including government, corporate, and mortgage-backed securities. This diversification reduces the risk compared to holding individual bonds or concentrating on a single sector of the bond market.
2. Income Generation
Regular Interest Payments: BND invests in bonds that pay interest, providing a consistent stream of income. If you're a retiree or someone looking for reliable income without the volatility of stocks, BND can be a good choice.
3. Lower Risk
Less Volatile Than Stocks: Bonds are generally less volatile than stocks, which makes BND a safer option for risk-averse investors. It tends to fluctuate less and is less affected by market swings.
Stability: Since BND tracks a broad basket of U.S. bonds, it provides stability during times of stock market turbulence. It can serve as a defensive asset in your portfolio, offering protection during market downturns.
4. Cost-Effective
Low Expense Ratio: With an expense ratio of just 0.035%, BND is extremely affordable. Compared to actively managed funds or other bond ETFs, it offers exposure to the bond market at a fraction of the cost.
5. Liquidity
Easily Tradable: As an ETF, BND can be bought and sold like a stock, meaning you have liquidity and can enter or exit the investment at any time during market hours. This makes it more flexible than holding individual bonds, which may be harder to sell quickly.
6. Accessibility for Small Investors
Low Minimum Investment: Unlike individual bonds, which may require large sums to purchase, you can buy BND in increments of a single share, making it accessible for investors with smaller portfolios.
7. Hedge Against Stock Market Volatility
Diversification in Times of Market Stress: When the stock market experiences significant volatility or downturns, bond prices often move in the opposite direction, helping balance out the performance of your overall portfolio. BND is a good way to hedge against market volatility.
8. Intermediate Duration for Balanced Risk
Moderate Duration Exposure: BND focuses on bonds with intermediate durations, balancing the risk between short-term and long-term bonds. This makes it less sensitive to interest rate changes compared to long-duration bonds, while still providing the benefits of bond exposure.
9. Performance During Economic Uncertainty
Defensive Nature: Bonds are generally seen as safer during economic uncertainty. While the stock market can be volatile during recessions or periods of high inflation, bonds tend to provide more stability and reliable returns.
10. Tax Efficiency
More Tax-Efficient Than Actively Managed Funds: Since BND is passively managed, it tends to have fewer capital gains distributions, which can be more tax-efficient than actively managed bond funds.
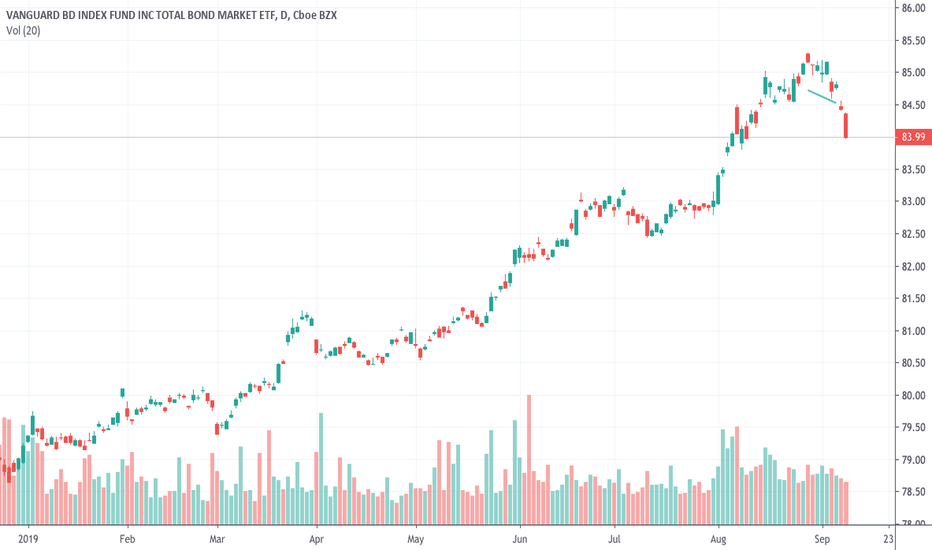
BND trade ideas
revisiting the BOND/SPY ratioIt's possible today was the day bonds finally reverse and start becoming attractive to investors again. This is a monthly chart with steep bullish divergence, so we're talking about a multi year (and possibly decades) of an uptrend from here. If you don't know how to read a ratio chart, it simply shows the amount of SPY etf it takes to make one BND etf. If it's in an uptrend, then it takes more SPY to make one BND. That could mean 3 possibilities -
1. SPY and BND rally together but BND outperforms to the upside
2. SPY keep going down and BND goes down much less in percentage
3. SPY keeps dropping or stays stagnant for years while BND rallies
My guess is 3. Especially if SPY drops and then meanders for years with meager returns, BONDS may become the play for the coming decade.
The Bid for BondsBND looks to have finished it's C wave and now getting ready to rally past most expectations. On the BND ETF, it should make new highs.
Strong weekly bullish divergence and A=C 1.272 which is a very common extension for C. For those looking for a fundamental reason for bonds to rally, I recommend David Rosenberg's excellent interview a few days ago on Wealthtrack - youtu.be/44_kSXbuJYc
James Bonds vs I SpySpy vs Bond ratio chart. An uptrend means that bonds are outperforming spy.
Monthly bull divergences, monthly PPO about to cross bullish, Slow Stochastic over 21 for the first time in 2 years. This is a generational opportunity for bonds. Chances are good that the economy tanks mid-year and Powell and the other geniuses at the FED rethink the rate hike strategy, so bonds will continue to rally vs SPY. 60/40 portfolio may become 10/90 by next year.
Are bonds not attractive? $BND $JNK $AGG $HYG $LQDWith cpi inflation up at 6.2 % why should I be willing to hold a bond fun which as way above average prices and yielding between 2% and 4.4% for junk bonds? Shouldnt I be avoiding this reach for yield and get either more constative and look for future discount opportunities, or should buy a traditional portfolio and pray a sell off doesnt happen over next 5-10 years? #worried
BND large scale paterns my work is applicable to all time scales. I prefer to stat with the entire data set and work down to the details. My intuition works best when I don't have skin in the trade.
The major fluctuations on the market have anachronistic traits seen in past and future.
BND total bond market.
Total bond market index( $BOND 1M ) Classic Wyckoff accumulationThe chart speaks for itself. I expect higher prices in the future meaning negatives yields...
Learn more about the Wyckoff Method : school.stockcharts.com
As time goes by, I will keep you updated on the evolution of the chart, so make sure to follow me on Tradingview
Disclaimer : This is not financial advice as I’m not a financial adviser.
This is just my knowledge on what can be said and done from the chart.
Due to the volatile nature of the cryptocurrencies market, it can change on a day to day basis.
Everyone is wise to manage their risk properly when considering any trading decision or activities.
Bond bubble about to blow.With a yield-to-maturity of only 2%, how much lower can it go (or prices of bonds rise) given that the 'real' rate of return is now negative? Deteriorating global economic growth will soon cause spreads to widen (a good portion of these ETF bond funds are in higher yielding corporate bonds) which will hurt bond prices.
BND: Defensive Against Trade WarI have three bond funds that I use for a regular market hedge as well as a possible target for short-term down market conditions. Unless some last minute Hail Mary comes out on this US/China trade dispute, I expect the rest of May and maybe June and July to be difficult months to weather in stocks. There's some money to be made, but it'll require strict vigilance to adhere to your trading signals and risk management rules.


