DMC GLOBAL Stock Chart Fibonacci Analysis 021524Trading Idea
1) Find a FIBO slingshot
2) Check FIBO 61.80% level
3) Entry Point > 18.6/61.80%
Chart time frame : B
A) 15 min(1W-3M)
B) 1 hr(3M-6M)
C) 4 hr(6M-1year)
D) 1 day(1-3years)
Stock progress : B
A) Keep rising over 61.80% resistance
B) 61.80% resistance
C) Hit the bottom
D) Hit the top
Stocks rise as they rise from support and fall from resistance. Our goal is to find a low support point and enter. It can be referred to as buying at the pullback point. The pullback point can be found with a Fibonacci extension of 61.80%. This is a step to find entry level. 1) Find a triangle (Fibonacci Speed Fan Line) that connects the high (resistance) and low (support) points of the stock in progress, where it is continuously expressed as a Slingshot, 2) and create a Fibonacci extension level for the first rising wave from the start point of slingshot pattern.
When the current price goes over 61.80% level , that can be a good entry point, especially if the SMA 100 and 200 curves are gathered together at 61.80%, it is a very good entry point.
As a great help, tradingview provide these Fibonacci speed fan lines and extension levels with ease. So if you use the Fibonacci fan line, the extension level, and the SMA 100/200 curve well, you can find an entry point for the stock market. At least you have to enter at this low point to avoid trading failure, and if you are skilled at entering this low point, with fibonacci6180 technique, your reading skill to chart will be greatly improved.
If you want to do day trading, please set the time frame to 5 minutes or 15 minutes, and you will see many of the low point of rising stocks.
If want to prefer long term range trading, you can set the time frame to 1 hr or 1 day.
BOOM trade ideas

$BOOM (DMC Global) Key intakes on this market:
- Downtrending with a neat series of lower highs & lower lows since mid 2021.
- Under normal circumstances this would give us a short bias. Howevers the price happens to be trading at/near a long term key demand area (run a volume profile of this market you will see that this is the most congested area).
- Momentum trending downwards since mid 2021 .... well, until this month. Month not closed yet, if it does close as is, similar or above then the momentum shifts as neatly displayed by the RSI plot.
- If you are already bullish, I invite you to hold your horses. The size of the most recent bearish candles is not enthusiastic for the bull. The volume is also not remarkable. Why is this bearishn hint? Because they should (be remarkable)! At this area you would expect a stronger bullish reaction (so far).
- Ok, then where to go from here? As mentioned above the price is at an inflection area, a demand zone, kissing the trendline. What does it tell you if it crosses and closes above with all the previous hints in mind? (Hint: the bears that have been seen this trendline respected and trusted no longer will)
- Conversely, what does it tell you if it breaks and closes below this area? (Hint: either those who had been giving support no longer are or they still hold long positions and are very keen to cut the losses they'll be seeing in their P&L )

Clear Risk Reward Ratio - Trading IdeaCan the price sustain at this level range?
My suggest entry for best RRR.. clear see on chart using immediate support and resistance.. for long term TP im using Fibo Retracement.

Broadening Wedge Bottom FishingThe ascending broadening wedge pattern hit the target to the downside so correction may be complete. There is also a harmonic pattern that hit the 1.272 and that would be D if, in fact, I placed X at the correct level. I see confluence at this level because it hit bottom at the target I set for the broadening wedge pattern. But placing X for a harmonic pattern can be very subjective, so you may see X elsewhere which changes the fib levels.
I bought BOOM earlier this year and traded the cup and handle pattern. I have kept an eye on it since I sold it. Very glad I sold it when I did as that would be a long fall down.
I noticed most folks are very bearish on BOOM. Sometimes I like to buy when lots are bearish, but not always. You know how you can follow a security but you have no idea why? LOL
Boom tends to move with oil and gas.
Broadening patterns belongs to the family of wedge patterns and can break up or down like a triangle can. It is not necessarily bearish like a rising wedge often is, in this case it broke to the downside in the end but did briefly break to the upside. The direction of the breakout is random. Very often these patterns have partial rises and partial declines that are followed by a breakout. When price rises from the lower trendline and fails to make the upper trendline it is likely to breakout lower. When price falls from the upper trendline and fails to make the lower trendline then the breakout is likely to be upwards.
The breakout occurs when price closes on the outside of the pattern, above the upper trendline or below the lower trendline. Trade in the direction of the breakout.
The target is the highest high in the pattern minus the lowest low in the pattern.
No recommendation. Of course, the moving averages look awful )o:
DMC Global Inc. provides a suite of technical products for the energy, industrial, and infrastructure markets worldwide. The company operates in two segments, NobelClad and DynaEnergetics. Its NobelClad segment produces and sells explosion-welded clad metal plates for use in the construction of heavy, corrosion resistant pressure vessels, and heat exchangers for oil and gas, chemical and petrochemical, alternative energy, hydrometallurgy, aluminum production, shipbuilding, power generation, and industrial refrigeration industries. The company sells its products through direct sales personnel, program managers, and independent sales representatives. Its DynaEnergetics segment designs, manufactures, markets, and sells perforating systems, including initiation systems, shaped charges, detonating cords, gun hardware, and control panels; and associated hardware for the oil and gas industry. It sells its products through direct selling, distributors, and independent sales representatives. The company was formerly known as Dynamic Materials Corporation and changed its name to DMC Global Inc. in November 2016. DMC Global Inc. was founded in 1965 and is headquartered in Broomfield, Colorado.

Boom has exploded boom company has exploded last week .. is it late to chase that b*tch??
I would say "DON'T CHASE THAT B*tch" .. "Never Chase B*tches"


$BOOM Parabolic Ascent Losing Steam $SPY $QQQ $DIA$BOOM DMC Global - finding possible resistance near $43.
Expecting a correction in the medium term, back to the mid-30s or lower.
See chart Fibonacci levels for possible targets.
$SPY $QQQ $DIA

BOOM - Bullish FlagAlready hit the resistance at $27.60. Looks to continue its uptrend towards the next resistance at $27.60. Should be able to profit for 3% at 27.55 or 5% at $28.08

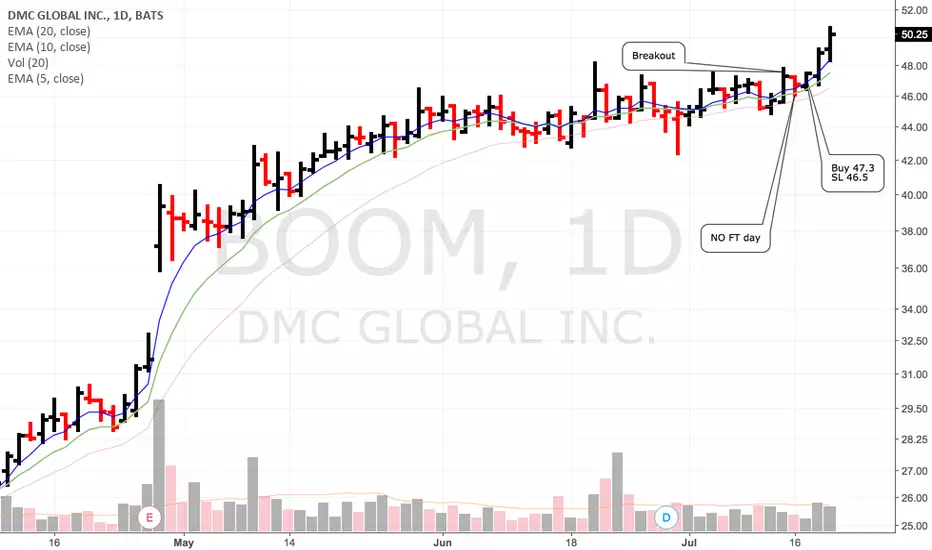
Intention to breakoutWhy I bet for a resistance breakout, if there is not happen yet and that puts me in a position of fortune-teller
Since I have as a rule to publish confirmed, resistance breakout and there is not happen yet
But I not making a stock market prediction
I am in the now and I am a trend follower with a price action orientation and I work and interpret the info that I have now
And based in the behavior of the price during the last 2 months and how it looks the price with regard to the resistance line, the price looks strong
(long lower shadows is like: we are not willing to go back) is a good sign of bullishness
Is the price action the reason that I have to share this idea without falling into predictions, because is happening in front of my eyes
