BUY | BrightSpring Health Services (BTSG) Current Price: $24.11
Change: +0.58 (+2.47%)
Volume: 1,529,511
52-Week Range: $17.50 – $24.50
Technical Overview:
Chart Pattern: Forming a bullish cup-with-handle pattern, indicating potential for a breakout.
Moving Averages:
50-Day MA: $22.80
200-Day MA: $21.50
Relative Strength Index (RSI): 65 – approaching overbought territory, but still within a bullish range.
Execution Plan:
Entry: $24.20
Stop Loss: $22.80
Take Profit: $26.50
Risk-Reward Ratio: 1:2
Rationale:
BrightSpring has surged approximately 38% in 2025, significantly outperforming the S&P 500. Analysts project a 269% increase in earnings per share this year, followed by 20% growth next year. The company recently sold its community living business to focus more on its pharmacy division and reduce debt.
BTSG trade ideas

Long Trade Setup – BTSG!📈
🔹 Asset: BrightSpring Health Services, Inc. (NASDAQ: BTSG)
🔹 Timeframe: 30-Minute Chart
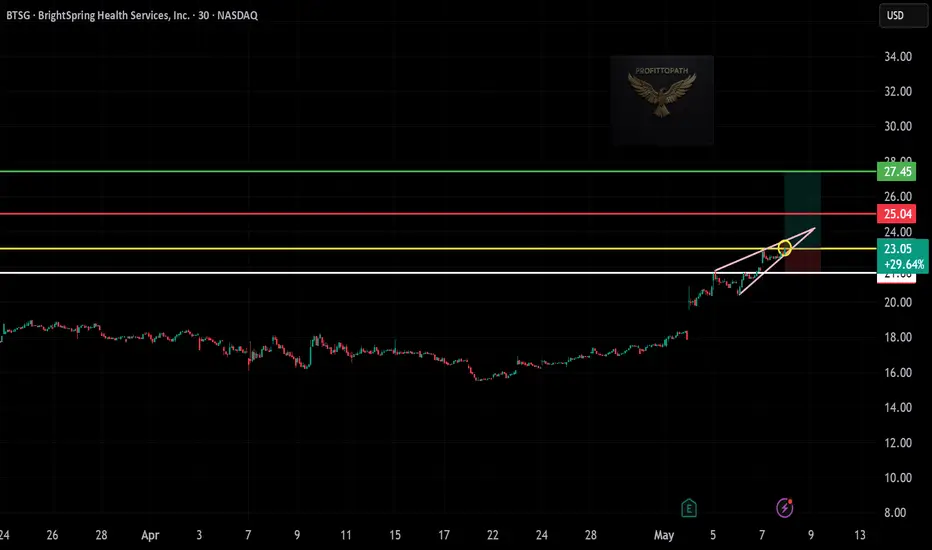
🔹 Setup Type: Bullish Wedge Breakout
📌 Trade Plan (Long Position)
✅ Entry Zone: Above $23.05 (Breakout Confirmation)
✅ Stop-Loss (SL): Below $21.66 (Wedge Invalidation Level)
🎯 Take Profit Targets
📌 TP1: $25.04 – First Resistance
📌 TP2: $27.45 – Measured Move Target
📊 Risk-Reward Calculation
📉 Risk: $23.05 - $21.66 = $1.39
📈 Reward to TP1: $25.04 - $23.05 = $1.99 → 1:1.43 R/R
📈 Reward to TP2: $27.45 - $23.05 = $4.40 → 1:3.16 R/R ✅
🔍 Technical Highlights
📌 Clean rising wedge breakout
📌 Strong bullish momentum following prior trend
📌 Volume build-up around breakout zone
📌 Higher highs and higher lows suggest strength continuation
📈 Execution Strategy
📊 Enter after confirmed breakout above $23.05
📉 Use SL below recent swing low ($21.66)
💰 Book partial profits at TP1, let winners ride to TP2
🚨 Invalidation Risk
❌ Exit if price falls below $21.66 with volume
❌ Avoid chasing if breakout lacks momentum
🚀 Final Take
✔ Bullish wedge breakout with momentum
✔ Excellent R:R profile for long setup
✔ Ride the breakout — stay disciplined and manage risk smartly