BEYOND MEAT strong bullish push to expect
Hi viewers, BYND in last periods only bearish trend, here now exepcting to see changes techncially picture looks strong
TP1:20
TP2:22
TP3:24
BYND trade ideas

Above and beyondBeyond Meat will be huge in the coming years IMO as the transition from us humans eating meat as our primary source of protien will ultimatly be made harder and most likly very expensive (check W H O there plenty of documents on agenda 2030 to go with what im saying)
Alternatives/subtritutes to actual meat should see the growth as it becomes the norm, weve already seen in 2022 beyond meat in mcdonalds and other fast food chains and also in most of the big name supermarkets across the globe.
Like other risk on asset BYND has alos seen a 90+% rejection from all time highs, during these high is when beyond meat launched, it was when the partnerships with mcdonalds was seen and also when we started to see it on tv and shelves in these stores.
Anyone who listens to what i talk about will know price moves before the news and during the time above price was getting ready to reject with very clean bearish reversal pattern (check chart below) during which retial investers and the majority of traders who follow retial logic was buying into this asset beliveing it will rocket on launch, this is how these big banks and intituions get paid by drawing in the hurd and shitting down their necks.
What we do in here we change that, we take from the cherry at the very top and filter it all the way down.!!!!
Long term hold and buying here at $16 with the potential of us seeing BYND above $150 in the near future.
First level of resistance here is $33 breaker, once we recliam this we can most defiently be comftable with " the bottom is in" and we sit back and watch.
Also note we may see two draws on liquidty at $54/$74 with a possible correction after, here we can add to our postion.

BYND bullish Wyckoff AccumulationBeyond meat has formed a classic Wyckoff accumulation pattern since September, broken the upper resistance and retraced back to the old resistance ( now support )
There's a strong diagonal resistance since June 2021, which price has be retraced numerous times before.
Price target determination:
- Distance from resistance and support of accumulation = distance travelled after breakout.
- This coincides with diagonal resistance mentioned above.
- $23 seems to be sensible target at the moment. If breakout of diagonal & strong market sentiment, breakout of diagonal resistance is a strong possibility.
- Stop loss at $15


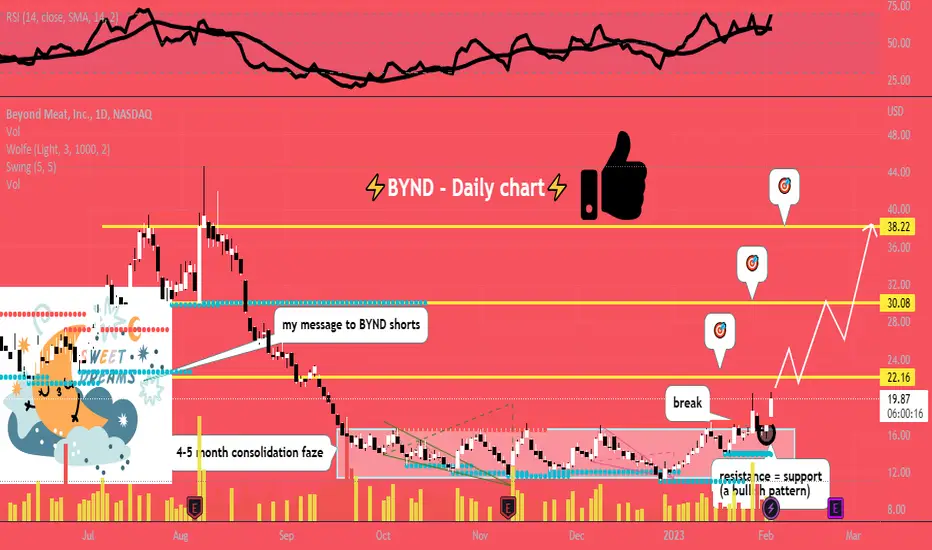
BYND finally breaks from consolidation 🥶4 month consolidation, breakout and retest of the previous resistance.
resistance turned support (bullish) now wants to head higher to 22-38 targets/local resistance areas.
Boost and follow for more! thanks ❤
BYND Potential for Bullish Continuation | 30th January 2023Looking at the H4 chart, my overall bias for BYND is bullish due to the current price being above the Ichimoku cloud , indicating a bullish market.
Looking for a pullback buy entry at 16.65, where the 38.2% Fibonacci line and overlap support is. Stop loss will be at 11.04, where the recent swing low is. Take profit will be at 22.54, where the overlap resistance is.
Any opinions, news, research, analyses, prices, other information, or links to third-party sites contained on this website are provided on an "as-is" basis, as general market commentary, and do not constitute investment advice. The market commentary has not been prepared in accordance with legal requirements designed to promote the independence of investment research, and it is therefore not subject to any prohibition on dealing ahead of dissemination. Although this commentary is not produced by an independent source, FXCM takes all sufficient steps to eliminate or prevent any conflicts of interest arising out of the production and dissemination of this communication. The employees of FXCM commit to acting in the clients' best interests and represent their views without misleading, deceiving, or otherwise impairing the clients' ability to make informed investment decisions. For more information about the FXCM's internal organizational and administrative arrangements for the prevention of conflicts, please refer to the Firms' Managing Conflicts Policy. Please ensure that you read and understand our Full Disclaimer and Liability provision concerning the foregoing Information, which can be accessed on the website.

BYND Potential for Bullish Continuation | 30th January 2023Looking at the H4 chart, my overall bias for BYND is bullish due to the current price being above the Ichimoku cloud, indicating a bullish market.
Looking for a pullback buy entry at 16.65, where the 38.2% Fibonacci line and overlap support is. Stop loss will be at 11.04, where the recent swing low is. Take profit will be at 22.54, where the overlap resistance is.
Any opinions, news, research, analyses, prices, other information, or links to third-party sites contained on this website are provided on an "as-is" basis, as general market commentary, and do not constitute investment advice. The market commentary has not been prepared in accordance with legal requirements designed to promote the independence of investment research, and it is therefore not subject to any prohibition on dealing ahead of dissemination. Although this commentary is not produced by an independent source, FXCM takes all sufficient steps to eliminate or prevent any conflicts of interest arising out of the production and dissemination of this communication. The employees of FXCM commit to acting in the clients' best interests and represent their views without misleading, deceiving, or otherwise impairing the clients' ability to make informed investment decisions. For more information about the FXCM's internal organizational and administrative arrangements for the prevention of conflicts, please refer to the Firms' Managing Conflicts Policy. Please ensure that you read and understand our Full Disclaimer and Liability provision concerning the foregoing Information, which can be accessed on the website.

Beyond Meat - The Vegan Short SqueezeIf looking at last year's POC of BYND, you can notice we have been oscillating above and below that $15 range since September 2022. BYND has been in this slightly sloping downward/sideways channel with the most recent low being the bottom of the value range, building a nice base for a move higher.
In recent days I've noticed some unusual options activity in a handful of highly shorted names and this is one of them.
Paired with bullish bets on these names with some sizeable money, overall indices this week finished on a strong close going into next week.
Above this $17.00 level on BYND is a volume gap where significantly less volume has traded as only 4 days moved it through this zone last year. These voids can sometimes fill rather quickly when price starts moving back through them. In conjunction with this, LBR MACD has a first cross which can be a long buying opportunity, with an RSI that has recently cooled off from overbought.
Today I opened a long BYND position. This is in anticipation that we test the upper part of the channel again as well as that $17 area, possibly getting into the gap. Mix in the fact that this stock has a float nearly 40% short, with earnings a month away; there could be a short squeeze over the next few weeks in this one.

BYND Long setupShort and sweet here.
BYND is showing signs of consolidation and reversal. Investors with high risk tolerance can take a long position at this location with a stop-loss around ~$14, as this would indicate failure to truly reverse. The first true confirmation of reversal would be a break out of its channel established in September, with a close above around ~$17.20. Full confirmation of reversal occurs with a close above ~$20.50.
There are also various options strategies which can be executed on this play. Look to the February and march contracts at $17.50 and $20.00, respectively, and if pursuing a more aggressive / risky strategy consider a call debit spread to limit losses.

Daily Sector WatchNo good picks for today. Still not breaking the bear market.
🟢WEED STOCKS TOP 10
Teradyne
Curaleaf Holdings
Green Thumb Industries
Trulieve Cannabis Corp
Canopy Growth Corp
Verano Holdings Corp
Cronos Group Inc
Tilray Brands Inc
Cresco Labs Inc
SNDL Inc
🔴CRYPTO COINS TOP 10
Bitcoin
Ethereum
Binance Coin
XRP
Dogecoin
ADA
Matic
Tron
Dot
Solana
🟣INDEXES
US30
S&P 500
FRA40
GER30
NTH25
ASX200
EUSTX50
JPN225
HK50
Banknifty
🔵SPACE STOCKS TOP 10
Iridium Communications Inc
Ses
Rocket Lab USA Inc
Aerojet Rocketdyne Holdings Inc
Viasat
Maxar Technologies
Eutelsat Communications
Astra Space Inc
Sats
Planet Labs
🟤RETAIL FOOD STOCKS TOP 10
Kroger Company
Albertsons Company
Sendas Distribiduira S A
Sprouts Farmers Market
Grocery Outlet Holdings
Weis Market Inc
Ingles Markets Inc
Arko Corp
Companhia Brasileira De Distribuidao American
Beyond Meat
alcohol, cars, big tech

Daily Sector Watch : Will Crypto beat the market?Weed stocks have been underperforming the other sectors while the rest is slowly starting to light up. However this could be a great oppertunity to get into late entries when the rest is confirmed to have taken a bullish direction weed should follow.
Crypto has been outperforming the other sectors this week as you can see all heatmaps are turning red.
Asian indexes have been performing better these days than european and american.
Space saw some massive gains after MAXAR TECHNOLOGIES INC takeover which other space stocks are starting to follow.
Top food stocks have been outperforming the index while some food stocks are lagging behind (could be a great investment).
🟢WEED STOCKS TOP 10
Teradyne
Curaleaf Holdings
Green Thumb Industries
Trulieve Cannabis Corp
Canopy Growth Corp
Verano Holdings Corp
Cronos Group Inc
Tilray Brands Inc
Cresco Labs Inc
SNDL Inc
🔴CRYPTO COINS TOP 10
Bitcoin
Ethereum
Binance Coin
XRP
Dogecoin
ADA
Matic
Tron
Dot
Solana
🟣INDEXES
US30
S&P 500
FRA40
GER30
NTH25
ASX200
EUSTX50
JPN225
HK50
Banknifty
🔵SPACE STOCKS TOP 10
Iridium Communications Inc
Ses
Rocket Lab USA Inc
Aerojet Rocketdyne Holdings Inc
Viasat
Maxar Technologies
Eutelsat Communications
Astra Space Inc
Sats
Planet Labs
🟤RETAIL FOOD STOCKS TOP 10
Kroger Company
Albertsons Company
Sendas Distribiduira S A
Sprouts Farmers Market
Grocery Outlet Holdings
Weis Market Inc
Ingles Markets Inc
Arko Corp
Companhia Brasileira De Distribuidao American
Beyond Meat

Pumping the Air Brakes on BYND and Carving the bottomSTOCK ANALYSIS FOR NASDAQ:BYND
Buy Zone trending line upwards from $11-$15
Indicators used
* 195 MINUTE TIME INTERVAL (This is HALF THE SESSION TIME, VERY VALUABLE TO KNOW)
* ZIG ZAG (ABSOLUTELY SIMPLE BUT AMAZING INDICATOR TO INDICATE AND ESTABLISH TREND)
* DIRECTIONAL BIAS (VERY AMAZING INDICATOR)
During the falling knife phase, the directional bias indicator was clearly showing it was a NO BUY. You can see that the buyers starting to step in and
* the mid-November pump from 11.30 to 16 was a SIGN indicating that BYND selling pressure was being absorbed at these levels.
* Chart wise, there will be a clear bottom line that is being carved out, but its worth staying in.
* The macro SPY / Rates / Economy issue is affecting this stock, but I have confidence that despite lowered job numbers in the future in the incoming recession,
BEYOND will continue to be a consumer staple because of the quality and innovation in what they do and the partnerships.
* They are partnered with Taco Bell, Pepsi, McDonalds, Carls Jr
* They have an insanely good beef jerky product

BYND 1/20 12.5PSP500 may bounce and retest the 3960, but i dont care about it.
Cuz BYND has its own trend, i hope it will move up to 13.5-14.0 level as market bounce
bearish both on daily and weekly chart.
One reason i dont like is when ppl can not afford cheap real beef as cpi blast, who will buy the high price beef made by vegetables?

BYND is still bind in a range.Beyond Meat - 30d expiry - We look to Sell at 16.18 (stop at 17.45)
The primary trend remains bearish.
This stock has seen poor sales growth.
Price action continued to range between key support & resistance (12 - 16) and we expect this to continue.
Preferred trade is to sell into rallies.
16 continues to hold back the bulls.
The bias is to break to the downside.
Our profit targets will be 13.01 and 12.51
Resistance: 14.30 / 15.50 / 16.30
Support: 13.10 / 12.10 / 11.56
Disclaimer – Saxo Bank Group.
Please be reminded – you alone are responsible for your trading – both gains and losses. There is a very high degree of risk involved in trading. The technical analysis , like any and all indicators, strategies, columns, articles and other features accessible on/though this site (including those from Signal Centre) are for informational purposes only and should not be construed as investment advice by you. Such technical analysis are believed to be obtained from sources believed to be reliable, but not warrant their respective completeness or accuracy, or warrant any results from the use of the information. Your use of the technical analysis , as would also your use of any and all mentioned indicators, strategies, columns, articles and all other features, is entirely at your own risk and it is your sole responsibility to evaluate the accuracy, completeness and usefulness (including suitability) of the information. You should assess the risk of any trade with your financial adviser and make your own independent decision(s) regarding any tradable products which may be the subject matter of the technical analysis or any of the said indicators, strategies, columns, articles and all other features.
Please also be reminded that if despite the above, any of the said technical analysis (or any of the said indicators, strategies, columns, articles and other features accessible on/through this site) is found to be advisory or a recommendation; and not merely informational in nature, the same is in any event provided with the intention of being for general circulation and availability only. As such it is not intended to and does not form part of any offer or recommendation directed at you specifically, or have any regard to the investment objectives, financial situation or needs of yourself or any other specific person. Before committing to a trade or investment therefore, please seek advice from a financial or other professional adviser regarding the suitability of the product for you and (where available) read the relevant product offer/description documents, including the risk disclosures. If you do not wish to seek such financial advice, please still exercise your mind and consider carefully whether the product is suitable for you because you alone remain responsible for your trading – both gains and losses.

BYND Bearish inclined naked calls 2 Dec expiryWhats The Plan/Trade/Thought
BYND does alternative meat (beef). During an inflation period with interest hikes. I believe the company will get hit by more expensive loans and consumers will move to cheaper meat alternatives like chicken
Risk Mitigation
I see 16.51 as my indicator that my direction is wrong and I should exit
Can You Trade The Opposite Side (Y/N)
N
Trade Specs
Sold 410 Calls @ 0.13
Strike 19
37.2% to Strike
BP Used: 54k
Max Gain: 5330

$BYND - It can go up or it can go down.Classic bullish diamond formation. Should mean that the price will go up, but there's no reason for that to happen other than due to a squeeze which could happen as the stock is at 148% borrow fee at the moment.
On the other hand, BYND's financials are bad and the market may be about to go in bear mode which would instead support the move down.
The correct move here according to technical analysis is that the stock will go up. Having that in mind, one must not forget that technical analysis patterns often do not come to fruition and may even be inversed, so i'm thinking BYND is going to going to $8 first before it ever goes up at all for any reason. Taking the current markets in mind, a move up is not supported by anything oter than maybe covering into a bear market.
TLDR: Price go down.

BYND bind in a range.Beyond Meat - 30d expiry - We look to Sell at 16.18 (stop at 17.45)
The primary trend remains bearish.
This stock has seen poor sales growth.
Price action continued to range between key support & resistance (12 - 16) and we expect this to continue.
Preferred trade is to sell into rallies.
16 continues to hold back the bulls.
The bias is to break to the downside.
Our profit targets will be 13.01 and 12.51
Resistance: 13.10 / 14.30 / 15.50
Support: 12.10 / 11.56 / 11.00
Disclaimer – Saxo Bank Group.
Please be reminded – you alone are responsible for your trading – both gains and losses. There is a very high degree of risk involved in trading. The technical analysis , like any and all indicators, strategies, columns, articles and other features accessible on/though this site (including those from Signal Centre) are for informational purposes only and should not be construed as investment advice by you. Such technical analysis are believed to be obtained from sources believed to be reliable, but not warrant their respective completeness or accuracy, or warrant any results from the use of the information. Your use of the technical analysis , as would also your use of any and all mentioned indicators, strategies, columns, articles and all other features, is entirely at your own risk and it is your sole responsibility to evaluate the accuracy, completeness and usefulness (including suitability) of the information. You should assess the risk of any trade with your financial adviser and make your own independent decision(s) regarding any tradable products which may be the subject matter of the technical analysis or any of the said indicators, strategies, columns, articles and all other features.
Please also be reminded that if despite the above, any of the said technical analysis (or any of the said indicators, strategies, columns, articles and other features accessible on/through this site) is found to be advisory or a recommendation; and not merely informational in nature, the same is in any event provided with the intention of being for general circulation and availability only. As such it is not intended to and does not form part of any offer or recommendation directed at you specifically, or have any regard to the investment objectives, financial situation or needs of yourself or any other specific person. Before committing to a trade or investment therefore, please seek advice from a financial or other professional adviser regarding the suitability of the product for you and (where available) read the relevant product offer/description documents, including the risk disclosures. If you do not wish to seek such financial advice, please still exercise your mind and consider carefully whether the product is suitable for you because you alone remain responsible for your trading – both gains and losses.

BYND S/R Map : 1D ChartBYND is sitting at key support line (green).
If the support line holds - price will go re-test the orange line above and try to breakthrough.
If the support line fails - price will go down to test the orange line below for support. If the orange line holds as support - the green line will become resistance.

Billions in investment but a branding catastropheThere are no doubts that BYND is going nowhere! But why?
It's worth mentioning that they had a first wave of layoff (~40) in August, followed by second wave that happened yesterday. Yesterday more than half (words say 75%) of R&D department were notified virtually that they no longer work for BYND. Company has been struggling with cash flow for months, words on the street say "they only have cash till Feb"; that was before the recent massive layoff. But why a leading brand should struggle?
++ POOR MANAGEMENT: They were so hyped about early-stage growth (called early adoption) that they mistakenly imagined they growth rate will stay somewhat consistent for years and plant-based meant is indeed the future (something like Apple and Mac). Well obviously, they were wrong! Adam Hanft in an article for AFN talks about this in depth but highlights are that:
"If you’re selling a revolutionary capsule that transports you anywhere in the world, in 30 seconds, you don’t need to say more than that. It’s what I call the “Declarative Moment.” A simple statement of being. But soon, 15 companies will be marketing that capsule. You’ll need to differentiate."
As Adam mentioned in the article when the early buzz of "plant-based meat" was cooled off meaning the category itself was not interesting enough, a product wouldn't sell just because it is a plant-based meant! That's were marketing and brand differentiation comes in, it is an area that almost all of the plant-based companies have failed! They give consumers no reason to consume their product over competitors, or even over regular meat; other than "it is plant-based, save the planet". If you look into the founders, it all makes sense, vegetarian scientists! They are not regular people, and they are not thinking clearly; they believe all that matters is the taste and texture and that would help to drive the sales. They don't look at the fact that many people have other reasons not to consume plant-based meant, one for example is "this is lab meat, and it is not safe to consume"! We have not seen any marketing campaign trying to address the general concerns around plant-based meant safety; not to mention the disaster that happened with Kim Kardashian Promo Ad! Even when they spend millions to bring Kim Kardashian on board, they make a mistake of INTENSIONALLY cutting out the senses that she is eating the Beyond Meat only to terrify people who are already avoiding plant-based meats based on the logic of "it is lab based so not safe".
POOR MANAGEMENT doesn't end with branding and marketing! As mentioned, elusive thoughts of "growth will stay consistent" caused spending spree! Many unthoughtful partnerships and contracts that they have no easy way out, massive rounds of hirings, and a new building! Just to clarify on that, their contract for their new R&D building will put a dent into their cash flow for years to come and the only reason they needed a new building was that "they were expanding rapidly" which tuned out to not be the case and with 75% layoffs (and more to come) the new gigantic building will be empty for sure!
"Composite man" already knows that! (If you are not familiar with this term, google "Composite man theory")
Chart obviously shows no signs of bottoming and even if it does after such a painful period it would need a long time to consolidate at the bottom! every upward move will see massive selling pressure, all the investors, and shareholders trying to on-load some shares at higher prices. Revival of BYND will most likely not happen, or at least not in the near future (not in this decade)!

Beyond Meat's bull runLong entry: 14 usd
Take profit: 4000 / 8000 usd
This is my personal opinion and this is not a financial advice! Good trading!

BYND monthly at the bottom stop loss $0 take profit $136.36BYND monthly at the bottom stop loss $0 take profit $136.36 at point of control.

Bullish HaramiBullish harami pattern on the 1W Beyond Meat chart. Example of a trend reversal.
#TheTradeSchool

You will eat the fake meat and you will be happyThis thing is oversold for almost a year. With a meat tax coming to the EU and the McPlant to the US it has nowhere to go but up.
