BYND: No Bid.Beyond Meat had quite the run-up following their Nasdaq debut, but today we see them trading below their IPO price for the first time.
Despite their success in getting to public markets quickly, there are questions as to their overall liquidity. Free cash flow took a big hit in Q4, and similarly so after Q1 earnings in late February.
For some context: Impossible Foods is seeking short-term credit facilities in a similar position.
www.reuters.com
BYND trade ideas

BYND: Following a spectacular rally from IPO, BYND went througha very deep wave 2 retracement. Appears that it has also printed another 1-2 and should be on the crest of a 3 of 3 movement.


BYND Round DownBYND is going to complete its rounding down formation until it meets support around the $75-76 area. The momentum of the overall market will carry it to these levels.
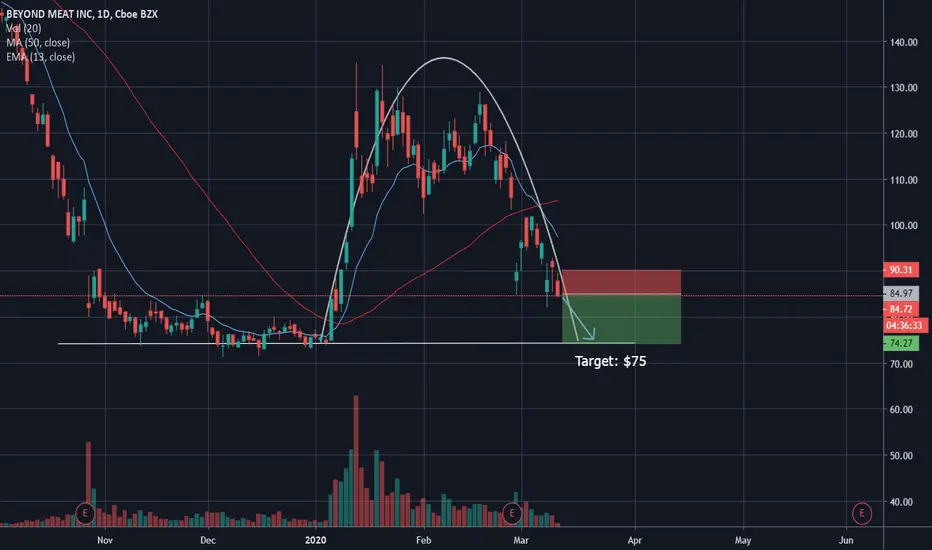
BYND heading lowerBYND now in a choppy zone, if we can get below $84 then this could shoot down to 73 quick before making another bounce, careful on this as IV is high and these options move fast.

BYND Round DownBYND is going to continue its downward trend now that its filled its gap. This is a sign of a reversal as well as the forming of a rounding down formation. This will play until support is reached at $85.

NO TRADES TODAY!Hi Guys,
No trades today but look at what TrendSpotter picked up!
See ya Monday,
Enda


Beyond Meat Bullish despite Deep retrace $bynd
Super earnings were lost among the noise in the market,
The stock has retraced deep but to a bullish fib 0.786 level, typical wave 2 level.
Upside targets $100 & $110

BYND Meat Earnings Date ApproachingWe have a wedge pattern forming on the BYND 4hr chart as we get closer and closer to the earnings date on the 27th after the market closes. Price could really break out either way.
Last quarter it earnings surpassed Wall Street's estimates by posting a profit of $0.06 per share on revenue of $92 million vs the expected $0.03 on revenue of $82.2 million.
Stay tuned.
Disclaimer:
I do not provide personal investment advice and I am not a qualified licensed investment advisor. I am an amateur investor.
All information found here, including any ideas, opinions, views, predictions, forecasts, commentaries, suggestions, or stock picks, expressed or implied herein, are for informational, entertainment or educational purposes only and should not be construed as personal investment advice. While the information provided is believed to be accurate, it may include errors or inaccuracies. I will not and cannot be held liable for any actions you take as a result of anything you read here.
Conduct your own due diligence, or consult a licensed financial advisor or broker before making any and all investment decisions. Any investments, trades, speculations, or decisions made on the basis of any information found on here, expressed or implied herein, are committed at your own risk, financial or otherwise.

+$1100 on $BYND in 1 minHi Guys,
I quick move in $BYND today. Up $1100 and done for today.
Enjoy,
Enda


BYND - Trade the bounceBYND successfully defended 87 area. This tells me that this is a short term bottom. My problem with the current structure is that I am still not confident on the current RSI levels. I think that it might dip near 81 before it bounces.
This is a buy below 87, stop below 76(or 81 depending on market conditions). Bounce target of 100. After the bounce, I'll count it as a lower high the I'll reshort. I am still not bullish on us equities.

Beyond Meat On alert $bynd
Possible entry on break above Middle bollinger band and horizontal resistance $104.
Target price $112 short term
Stop loss $101.50
Set for the CNBC bump after last nights interview with Jim Cramer
PLEASE GIVE US A LIKE IF YOUR APPRECIATE OUR CONTENT

BYND Retest/RemountBYND fell down with the market after earnings. But rallied on support at the $185 level, followed by another green candle to partially fill the gap in its chart. I think the retest off support and remount on a strong candle will carry this stock to the $105 level before it faces more resistance.

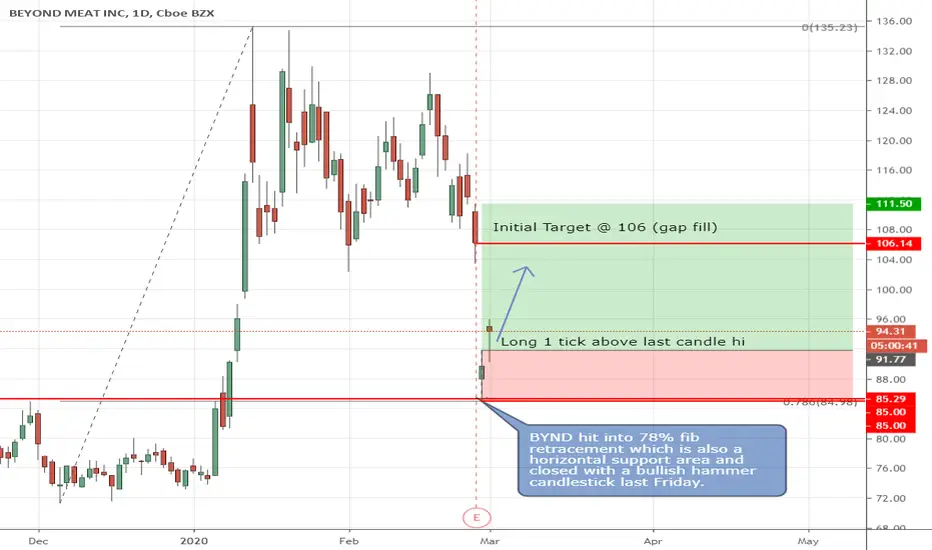
BYND - looking to close gap Tested support at 85 last Friday and closed a bullish hammer. Long with initial target at gap fill area 104-106..
$BYND Short Brings Home the BaconBYND has finally imploded again after earnings. We called this as a short candidate at $122 on 1/22/20. Now, traders should be up over 30 pts and it's time to start banking the gains. Support remains still far below in the $75 area.
See prior call:


Beyond Meat has massive growth but Punished $bynd
Maybe on a different day the post earnings move may have gone the other direction.
Would not be surprised to see it rally today after a very deep retrace.
$105 is the critical level.
Short interest 24%
Earnings highlights, Source SeekingAlpha
Beyond Meat (NASDAQ:BYND) reports revenue jumped 212% to $98.5M in Q4.
Gross profit soared to 34.0% sales vs. 25.0% a year ago off the sales leverage.
Net income was -$0.5M vs. -$7.5M a year ago.
Adjusted EBITDA arrived at $9.5M vs. -$3.8M last year and the consensus mark of $5.8M.
Looking ahead, Beyond Meat anticipates FY20 revenue of $490M to $510M vs. $486M consensus and adjusted EBITDA as a percentage of revenue close to the 2019 level. Gross margin is seen landing in a range of 33% to 35% for the full year.


BEYOND MEAT INC (BYND) DailyDates in the future with the highest probability for price direction reversals

BYND- Bullish continuation or distribution?Whether you like it or not, BYND is the first mover in the alternative meat industry.
There is just way too much upside and growth to be captured in this nascent industry.
Future trend toward green environment and sustainability will only push this industry higher.
Three scenarios-
#1. Test the local resistance one more time and break out of the bull flag pattern. Third time is the charm!
#2. Retrace first, then trapped shorts cover their shorts which propel the price higher. Swing long opportunity.
#3. Key support lvl broken. Long at the second key support lvl. Positional long opportunity.
Click like & follow me if you find my analysis useful. Much appreciated!
