BYND trade ideas

Beyond bullish RSI.We look left, we see the exact same set-up going from 2019-2020; a slowly declining share price, with increasing bullish divergence.
In 2020, the breakout led to a target price within the golden pocket at at 135 from 71, a 90% increase.
Now we have potential for a 100-130% share price increase to meet the golden pocket.

Beyond meat hit major support Beyond has hit a support level set by IPO price and Covid dip in March 2020.
It has also hit the lower declining wedge level suggesting a reversal soon


BYND chart shows one gigantic bullish pennantA bullish pennant is forming when looking at the entire history of this chart. The price balances around the high volume line (red). The breakout of the pennant is highly speculative and could be way earlier.
I don't give financial or investments advice just my point of view.

Beyond Meat seems on the verge of a breakoutIt seems to me that last months of the Beyond Meat chart is showing similar aspects to an earlier rally. Aside from the chart data, there's also a lot of bullish news going around. I don't expect this to lay around it's IPO valuation price for long.
This is no financial advice.

Beyond Meat chart shows a lot of curves, looks like a symmentry.It seems like a symmetry of pattern of curves. Just an idea, let me know what you think of it.

BYND UpdateSo my pennant wasn't correct last week, it actually formed a much bigger one. As you can see, it's overbought on the hourly, so probably a bear trap dip this afternoon and possibly tomorrow. Things like to back test the pennant before breaking out so a down day won't surprise me but I would not short this stock.
Rather wait for the breakout and go long. Target appears to be gap resistance from earnings, $85.
Of course everyone knows this garbage can get there in a hurry with a short squeeze, so it may happen as early as tomorrow, lol. Might be worth a day trade. Keep an eye on it tomorrow.
BYND reversalI don't even like BYND meat
but supposedly bears are piling onto the stock, and so I looked
The chart looks poised for a reversal higher on both the daily, weekly, and monthly charts.
If they got it to break to new lows I could see it going lower but right now it looks like it should go higher, which would kill all the bears.

BYND - Did you forget about Beyond Meat?Potential triangle/inverse head and shoulders forming as well as weekly bullish divergence. These sort of stocks like to run while the market is choppy which i expect into March. Breakout above 80

BYND - levels to watch 1/10/22$BYND
Support 62.94
Resistance 70.57
Consider Calls above 72.75
Consider Puts below 62.94
The 107k 70p sell on 1/07 caught my eye. Most other large purchases on 1/07 were leaps - the other big purchases that are DTM puts seem to be the closing of some OI - will confirm today
see my twitter for more

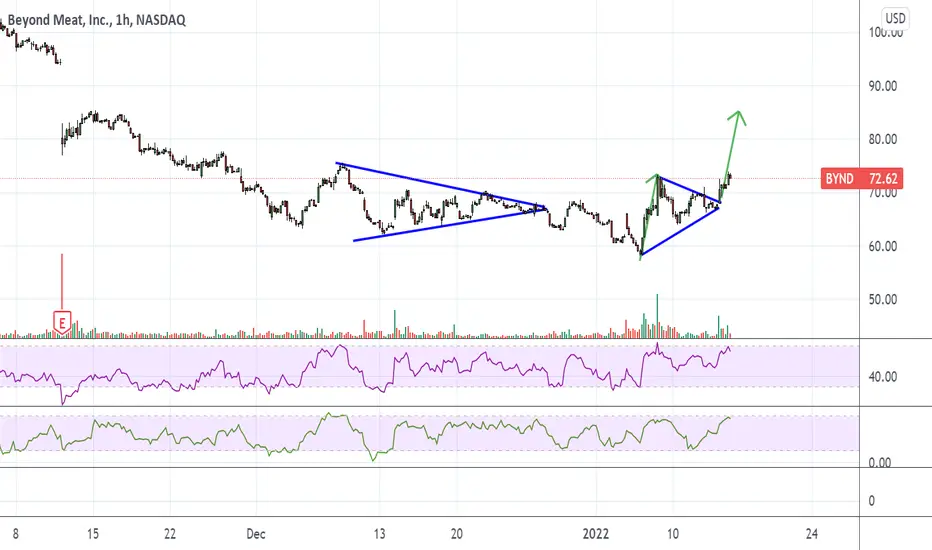
BYNDLooks to me like BYND is forming some sort of pennant today.
I think it moves big on Monday, could be worth playing a spread or maybe a protected long position. The top is probably in for the day so you might as well wait until right before close to make a decision.
I'm leaning bullish based on daily chart patterns but it looks like a lot of people who bought the past month are selling at $71 and bailing. That was the resistance for the past month. i still think it's a garbage stock though, a mashed pea recipe is not worth $4.5B.

BYND at a remarkable opportunity!$BYND as you can see, we have a nice pennant charted up with a breakout move of ~$130
We can see the breakout to the downside. But it seems that this is going to invalidate the initial breakout by catching support here and continue the breakout move up. If we can see just a tad more confirmation of this support, this would make my target for BYND to be $202
Making this a a 170% return on investment if you enter long at $75 (shares)
I largest concern is the $113 level, because here we can reject off of the pennant and begin the downtrend again. I will be watching it carefully at that level
Reversal here is also supported with alot of strength coming in with $SPY, $QQQ, $SPX, and $ES and massive buying pressure on BYND down here
Visit my profile for more trading ideas

To Infinity and Beyond (Meat)?Beyond Meat - Short Term - We look to Buy at 60.97 (stop at 55.50)
Previous support located at 60.00. The bullish engulfing candle on the daily chart is positive for sentiment. We look for a temporary move higher. This provides an excellent risk/reward opportunity to fade the current bearish move.
Our profit targets will be 85.29 and 94.12
Resistance: 90.00 / 100.00 / 115.00
Support: 60.00 / 50.00 / 45.00
Disclaimer – Saxo Bank Group. Please be reminded – you alone are responsible for your trading – both gains and losses. There is a very high degree of risk involved in trading. The technical analysis, like any and all indicators, strategies, columns, articles and other features accessible on/though this site (including those from Signal Centre) are for informational purposes only and should not be construed as investment advice by you. Such technical analysis are believed to be obtained from sources believed to be reliable, but not warrant their respective completeness or accuracy, or warrant any results from the use of the information. Your use of the technical analysis, as would also your use of any and all mentioned indicators, strategies, columns, articles and all other features, is entirely at your own risk and it is your sole responsibility to evaluate the accuracy, completeness and usefulness (including suitability) of the information. You should assess the risk of any trade with your financial adviser and make your own independent decision(s) regarding any tradable products which may be the subject matter of the technical analysis or any of the said indicators, strategies, columns, articles and all other features.
Please also be reminded that if despite the above, any of the said technical analysis (or any of the said indicators, strategies, columns, articles and other features accessible on/through this site) is found to be advisory or a recommendation; and not merely informational in nature, the same is in any event provided with the intention of being for general circulation and availability only. As such it is not intended to and does not form part of any offer or recommendation directed at you specifically, or have any regard to the investment objectives, financial situation or needs of yourself or any other specific person. Before committing to a trade or investment therefore, please seek advice from a financial or other professional adviser regarding the suitability of the product for you and (where available) read the relevant product offer/description documents, including the risk disclosures. If you do not wish to seek such financial advice, please still exercise your mind and consider carefully whether the product is suitable for you because you alone remain responsible for your trading – both gains and losses.


BYNDMID-TERM: Daily tweezer bottom with volume at the PCZ of a bullish shark after breaking out of a wedge on high volume, a lot of good news recently, almost 40% short interest and rising call option volume. (not financial advice)

Beyond ~ BYNDHuge reversal today in beyond meats. Could see this potentially go on and fill the gap in the lower 90's!


BYND - Beyond MeatInteresting set-up looking for lows at current or near current levels for a rally to 100+ shortly

Beyond meat to tripleBYND has touched its absolute support derived from two other previous lows and two previous highs, forming a symmetrical triangle.
I have this chart in GBP for reasons i'm not going to explain. But BYND has the potential to get to £140 within next 6-8months IMO. This would direct it right ot the 0.786 fib level.

$BYND What type of meat does Beyond have for us in 2022$BYND has been riding the previous sloping resistance. Looking for a move back towards the new sloping resistance. PT ~75 -> 80~ short term. then back down. A break out of the red sloping resistance could retest then breakout to the upside, a failed test would bring $BYND back down to the demand zone.
