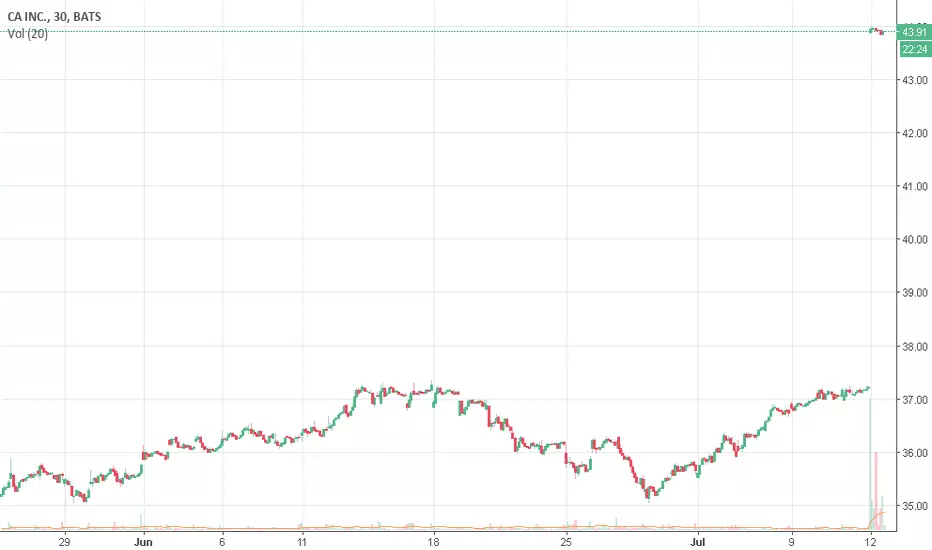
[CA] phase 3 Put stop loss in $43,37. Theoretically it's in phase 2 (price over 30MM), but there's a support for 4 months.
Key stats
About Xtrackers California Municipal Bonds ETF
Home page
Inception date
Dec 14, 2023
Structure
Open-Ended Fund
Replication method
Physical
Dividend treatment
Distributes
Distribution tax treatment
Ordinary income
Income tax type
Capital Gains
Max ST capital gains rate
39.60%
Max LT capital gains rate
20.00%
Primary advisor
DBX Advisors LLC
Distributor
ALPS Distributors, Inc.
CA is passively managed to hold a broad portfolio of USD-denominated investment grade debt issued by the state of California and its agencies. Interest income must be exempt from federal income tax and the alternative minimum tax (AMT). Eligible securities must have at least $25 million outstanding face value and at least one-month remaining term to maturity. The index excludes tobacco sector bonds, floating and variable rate notes, secondarily insured securities, custodial receipts, muni commercial paper, private placements, 144A securities, Municipal Liquidity Facility bonds, and securities in legal default. The resulting portfolio is market value-weighted, subject to a 25% single issuer cap. The index rebalances on a monthly basis.
Related funds
Classification
What's in the fund
Exposure type
Municipal
Bonds, Cash & Other100.00%
Municipal96.91%
Mutual fund3.08%
Cash0.01%
Top 10 holdings

CA Detected possible acquisition or asset purchase!!!CA: ca inc
2018-07-11 18:30:04
Detected possible acquisition or asset purchase

$FDS/$CA - Pesky algosReally no TA or opinion basis for this, just kind of amazed I've seen so many charts just this past week that look 84% similar in so many ways. ($FDS, $BIDU, $WLK, $CA, - just off top of my head now). For those who have no idea what the "Bubble analysis" project is - it's a LPPL (Log-periodic power


CA Technologies Long - $CA$CA Short Term Trade - CA Technologies oversold and holding key support w/ ER coming Wednesday 08/02.

CA: How Long the Consolidation Zone can Bog Down?I believe that successful trading strategies rely heavily upon identifying consolidation zones . Consolidation zone s provide us the right direction of the market. Consolidation happens when a market move sharply upside or downside. Later, a trader can use these consolidation zones to identify


See all ideas
Summarizing what the indicators are suggesting.
Oscillators
Neutral
SellBuy
Strong sellStrong buy
Strong sellSellNeutralBuyStrong buy
Oscillators
Neutral
SellBuy
Strong sellStrong buy
Strong sellSellNeutralBuyStrong buy
Summary
Neutral
SellBuy
Strong sellStrong buy
Strong sellSellNeutralBuyStrong buy
Summary
Neutral
SellBuy
Strong sellStrong buy
Strong sellSellNeutralBuyStrong buy
Summary
Neutral
SellBuy
Strong sellStrong buy
Strong sellSellNeutralBuyStrong buy
Moving Averages
Neutral
SellBuy
Strong sellStrong buy
Strong sellSellNeutralBuyStrong buy
Moving Averages
Neutral
SellBuy
Strong sellStrong buy
Strong sellSellNeutralBuyStrong buy
Displays a symbol's price movements over previous years to identify recurring trends.
Frequently Asked Questions
An exchange-traded fund (ETF) is a collection of assets (stocks, bonds, commodities, etc.) that track an underlying index and can be bought on an exchange like individual stocks.
CA trades at 24.20 USD today, its price has risen 0.04% in the past 24 hours. Track more dynamics on CA price chart.
CA net asset value is 24.20 today — it's fallen 0.09% over the past month. NAV represents the total value of the fund's assets less liabilities and serves as a gauge of the fund's performance.
CA assets under management is 20.55 M USD. AUM is an important metric as it reflects the fund's size and can serve as a gauge of how successful the fund is in attracting investors, which, in its turn, can influence decision-making.
CA price has fallen by −0.37% over the last month, and its yearly performance shows a −4.57% decrease. See more dynamics on CA price chart.
NAV returns, another gauge of an ETF dynamics, have fallen by −0.09% over the last month, showed a 0.64% increase in three-month performance and has decreased by −0.95% in a year.
NAV returns, another gauge of an ETF dynamics, have fallen by −0.09% over the last month, showed a 0.64% increase in three-month performance and has decreased by −0.95% in a year.
CA fund flows account for −1.21 M USD (1 year). Many traders use this metric to get insight into investors' sentiment and evaluate whether it's time to buy or sell the fund.
Since ETFs work like an individual stock, they can be bought and sold on exchanges (e.g. NASDAQ, NYSE, EURONEXT). As it happens with stocks, you need to select a brokerage to access trading. Explore our list of available brokers to find the one to help execute your strategies. Don't forget to do your research before getting to trading. Explore ETFs metrics in our ETF screener to find a reliable opportunity.
CA invests in bonds. See more details in our Analysis section.
CA expense ratio is 0.07%. It's an important metric for helping traders understand the fund's operating costs relative to assets and how expensive it would be to hold the fund.
No, CA isn't leveraged, meaning it doesn't use borrowings or financial derivatives to magnify the performance of the underlying assets or index it follows.
In some ways, ETFs are safe investments, but in a broader sense, they're not safer than any other asset, so it's crucial to analyze a fund before investing. But if your research gives a vague answer, you can always refer to technical analysis.
Today, CA technical analysis shows the buy rating and its 1-week rating is sell. Since market conditions are prone to changes, it's worth looking a bit further into the future — according to the 1-month rating CA shows the sell signal. See more of CA technicals for a more comprehensive analysis.
Today, CA technical analysis shows the buy rating and its 1-week rating is sell. Since market conditions are prone to changes, it's worth looking a bit further into the future — according to the 1-month rating CA shows the sell signal. See more of CA technicals for a more comprehensive analysis.
Yes, CA pays dividends to its holders with the dividend yield of 3.27%.
CA trades at a premium (0.11%).
Premium/discount to NAV expresses the difference between the ETF’s price and its NAV value. A positive percentage indicates a premium, meaning the ETF trades at a higher price than the calculated NAV. Conversely, a negative percentage indicates a discount, suggesting the ETF trades at a lower price than NAV.
Premium/discount to NAV expresses the difference between the ETF’s price and its NAV value. A positive percentage indicates a premium, meaning the ETF trades at a higher price than the calculated NAV. Conversely, a negative percentage indicates a discount, suggesting the ETF trades at a lower price than NAV.
CA shares are issued by Deutsche Bank AG
CA follows the ICE AMT-Free Broad Liquid California Municipal Index. ETFs usually track some benchmark seeking to replicate its performance and guide asset selection and objectives.
The fund started trading on Dec 14, 2023.
The fund's management style is passive, meaning it's aiming to replicate the performance of the underlying index by holding assets in the same proportions as the index. The goal is to match the index's returns.