CCC Intelligent (NASDAQ: $CCCS) Slides 17% Amid Insider SalesCCC Intelligent Solutions Holdings Inc. (NASDAQ: NASDAQ:CCCS ) saw its stock fall sharply in recent trading. On April 7th, 2025, shares dropped 17.84% in pre-market trading. This sharp decline pointed to a major shift in investor confidence.
Recent insider activity may have contributed to the drop. CAO Rodney Christo sold 5,846 shares. Board member Eileen Schloss sold 27,478 shares. These insider transactions raised concerns among market participants. Despite the drop, CCC Intelligent maintains a market cap of $5.60 billion. It trades at a price-to-earnings (PE) ratio that reflects investor valuation against earnings.
Seven research firms rate the stock as a “Moderate Buy.” This suggests that analysts still consider the stock a potential opportunity. Meanwhile, JPMorgan Chase & Co. has significantly raised its stake. The firm boosted its holdings by 753.3% during Q4. This large move may reflect institutional confidence in the company's long-term outlook.
As of the latest update at 1:00 PM, CCCS trades at $8.87, down $0.15 (1.66%). Volume stands at 15.34 million shares.
Technical Analysis
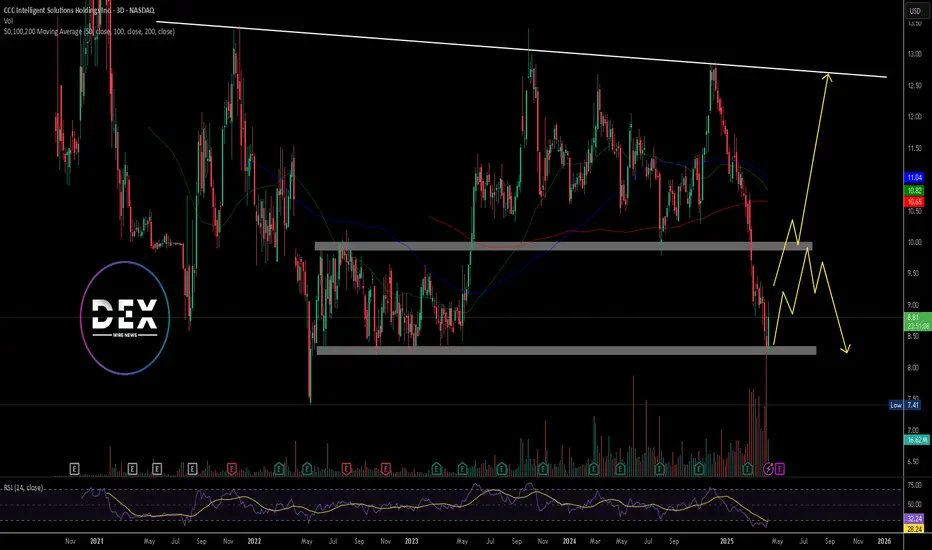
The 3-day chart shows a strong downtrend with high selling volume. Price touched a major support zone near $8.20 and bounced slightly. Resistance lies near $9.80 to $10.00. This zone could serve as a barrier for further upside as the price needs to break above it to signal recovery.
A descending trendline from prior highs caps the upside near $12.50. A break above this trendline could also confirm a trend reversal. The 3-day RSI sits at 33.26, close to oversold territory. This may hint at short-term bounce potential toward the resistance at the $10 level. However, downside risk remains if price fails to hold current support at the $8 level. A break below the $8 level, however, may target $7.40 previous low.
CCCS trade ideas
CCCS - BuyI used TradingView's stock screener to find assets with ADX (14) crossing up 15 on Weekly charts and came upon this CCCS. All of this analysis is based on a Weekly chart. First and foremost this is the first time that ADX is crossing up 15 in the chart's history. Secondly, TD Sequential is on 8/9 of a Buy signal. Third, it's at the bottom of the Bollinger Band. Fourthly, it's at Fibonacci Pivots S2. Lastly, this exact spot is a convergence of several Fibonacci support levels. This looks like the bottom of a coming up trend.
38.20% pullback into Monthly Fibonacci Pivots S2:
38.20% pullback:
127.20% extension support:
Uptrend neared 2.618% extension:
ADX crossing up 15 first time in stock's history:
Bollinger Band lower band:

CCC Intelligent Solutions Holding Inc. Moon or BustChart was brought up on my stream today, and I wanted to post a chart. Looks like a nice run-up stock looking for a decent crash that should equal some pretty large percentage losses. Short term parabolic stock, so when those green trends break, the pump is pretty much over, and you'll want to start looking for an exit or short position on the retouch, which looks like it might end up being 13.9, but it's too hard to say right now, as those trends are held up on weak support.
CCC Intelligent Solutions Holding Inc. exhibits promising signs in its current chart analysis. On the daily timeframe, the Relative Strength Index (RSI) is indicating a bullish sentiment, although we haven't detected strong trend momentum yet. However, what makes this chart intriguing is the presence of a potential 'cup and handle' pattern nested within a larger 'cup and handle' formation.
Digging deeper into the 4-hour chart, we find crucial trend support, which has not been breached, and the RSI has yet to cross into bearish territory. This solidifies the foundation for a robust short-to-medium-term outlook.
Furthermore, a notable price gap has been observed at $12.5, providing an interesting point of reference for potential price movement.
The 1-hour RSI suggests a short-term correction may be on the horizon, supported by a subtle emerging trend. This could strengthen our 4-hour trendline, potentially setting the stage for a surge towards the $14 mark, with an optimistic stretch target of $15.72 in the event of favorable developments.
It's essential to note, however, that the 5-minute and 15-minute charts are currently showing signs of being overextended, indicating a need for caution in the short term.
In terms of price targets, we have an upper range of $13.9 to $14.05, while the lower range stands at $8.47 to $7.41. While a maximum price of $18 to $20 is not entirely out of the realm of possibility, it's essential to maintain a realistic perspective, and such levels may not be easily attainable.
In the unlikely event of a significant downturn, the stock could potentially dip below $5. In such a scenario, it's crucial to be prepared for a potential bounce when the drop stabilizes.
Looking ahead to the start of the trading week, should Monday open with a downward movement, it could present a compelling buying opportunity around the $12.54 mark, aligning with the prevailing trend. Such a move would also serve to reset the technical indicators, potentially paving the way for a push towards $14 and beyond.
In conclusion, CCC Intelligent Solutions Holding Inc. holds promise in its chart patterns and technical indicators, making it an interesting stock to watch. As with any investment, prudent risk management is advised, but the potential for exciting price movements in the coming sessions is certainly worth keeping an eye on.
Personally, I don't know if I'll give this stock another look, but I'll try to keep the prices update on my site, should it really start to get away from this chart. But overall, be careful, sell fast, and possibly try to enter a short position, it's a pretty nice setup, with limited but very real risk.
Analysis does not take any fundamentals into account. I've never heard of this company before.
Nick
Yolo to the Moon
