New Setup: CDNACDNA: I have a green setup signal(dot Indictor). It has an excellent risk-to-reward ratio(RR:). I'm looking to enter long near the close of the day if the stock can manage to CLOSE above the last candle highs(white line). If triggered, I will then place a stop-loss below(SL) and a price target above it(TP1-50%,move SL to breakeven)(TP2-50%).
********
Note: The above setups will remain valid until the stock CLOSES BELOW my set stop-loss level.
CDNA trade ideas

cw41 review and cw42 preview ($CDNA and $GDD)Last week this was one of my best looking setup. Unfortunately, there was a bearish behavior on the right side of the base. That's something you don't want to see. On top there was no possible buy point triggered.
For next week $GDD could form a possible buy point. Good right side of the base and high RS.
This is no trading advice. Make your own research.

Possible buy point $CDNA next weekWith a high relative strength and decreasing volatility, NASDAQ:CDNA could become a buy candidate next week. Let's see how the volumes develop.
Make your own research. This is no trading advice.

My Watchlist: CDNACDNA added to my watchlist. I got a setup signal(1). I'm looking to enter long near the close of the day if the stock can manage to close above the last candle highs(2). If so I will place a stop-loss below (3) and a price target above(4). Volume has been increasing last couple of months which big institutions are slowly accumulating this stock.

CareDx, Inc. - Trend reversalOn the above 2-week chart price action has corrected 95% since early 2021. A few reasons now exist to consider a long position:
1) Price action and RSI resistance breakouts.
2) Support on past resistance confirms.
3) Trend reversal. A higher high prints.
4) The wedge pattern allows for a price action forecast to 130.
Is it possible price action corrects further? Sure.
Is further correction probable? no.
Ww
Type: trade
Risk: <=6%
Timeframe for long: Sooner than late, from $9 at best.
Return: 1200%

CAREDX to $29 Inverse Head & Shoulders pattern BROKEN OUTIt's a nice pattern
Thought I would share
May be of interest to share holders ;)

$CDNA Continuation Long Term Channel UpHello, traders! Today we're spotlighting NASDAQ:CDNA (CareDx, Inc), which is exhibiting a compelling long-term Channel Up reversal structure. This formation indicates a robust bullish sentiment, which could potentially lead the stock to revisit its all-time highs and even explore new price levels in the coming years.
Chart Analysis:
Pattern: Channel Up Reversal
Current Price: $11.06
Volume: Ideally, increasing volume should accompany the price rise, confirming the strength of the reversal.
Key Observations:
The Channel Up pattern suggests a stable and consistent uptrend. The stock's ability to maintain higher lows over an extended period is a strong bullish indicator.
The reversal is taking shape after a period of consolidation, offering a clear channel structure as a roadmap for future price movements.
Trading Strategy and Targets:
First Target (TP1): Around $15-$16, aligning with the first significant Fibonacci retracement level and expected resistance.
Second Target (TP2): The next major Fibonacci area falls between $30-$34, where previous resistance could convert into new support, paving the way for further gains.
Third Target (TP3): Aiming for $55-$60 as the subsequent Fibonacci level and psychological resistance point.
Long-Term Targets:
All-Time High (ATH): Reaching for the ATH around $100. Breaking this level could trigger a strong psychological buying response.
Price Discovery Phase: If the momentum continues beyond the ATH, speculative targets could range between $200-$350, based on extended Fibonacci projections and market dynamics.
Trade Setup:
Entry Point: Consider entries on pullbacks to lower channel boundaries or after a high-volume breakout above recent highs.
Stop-Loss: Set stop-loss orders below the most recent swing low within the channel to protect from downward breaks.
Take-Profit: Gradually take profits at the described Fibonacci levels, potentially using a trailing stop to maximize gains.
Risk Management:
Invest cautiously, as long-term trades are susceptible to broader market shifts and specific sector impacts. Adjust your exposure based on your risk tolerance and always have an exit strategy in place.
Conclusion:
NASDAQ:CDNA offers a textbook example of a Channel Up reversal that could reward patient investors handsomely. Keep a close eye on industry trends and financial reports that could influence the stock’s trajectory. Happy trading and let’s ride this channel to new heights!
Disclaimer: This analysis is for educational and entertainment purposes only and is not financial advice. Always perform your own research and consult with a professional before making any investment decisions.

$CDNA would grow till the beginning of 2025NASDAQ:CDNA shows sign of preload from below.
Expecting growth till the end of next year. Good potential (x6 if predicted scenario)
Does not constitute a recommendation.
#furoreggs #investing #stocks #shares #idea #forecast #trading #analysis
If you want to discuss, please subscribe and challenge this point of view )

CDNA Entry for Wolf and Jaguar setupsCDNA is three days past its large down day following a small gap. This kind of trade setup shows a positive edge if you wait for three days after the drop to execute a buy. Let's see if it works this time!

CDNA Likely Set To FallBased on historical movement, the peak could occur anywhere in the larger red box. The final targets are in the green boxes. The pending bottom should occur within the larger green box as has been the historical case. Half of all movement has ended in the smaller green box. In this instance, the signal indicated SELL on March 18, 2022 with a closing price of 39.7.
If this instance is successful, that means the stock should decline to at least 38.81 which is the top of the larger green box. Three-quarters of all successful signals have the stock decline 6.683% from the signal closing price. This percentage is the top of the smaller green box. Half of all successful signals have the stock decline 12.867% which is the end point of the black dotted arrow. One-quarter of all successful signals have the stock decline 17.423% from the signal closing price which is the bottom of the smaller green box. The maximum decline on record would see a move to the bottom of the larger green box. These are the same concepts for the levels in the red boxes as well.
The ends/vertical sides of the boxes are determined in a similar fashion. The trough of the decline can occur as soon as the next trading bar after signal close, while the max decline occurs within the limit of study at 40 trading bars after the signal. A 0.75% decline must occur over the next 40 trading bars in order to be considered a success. Three-quarters of successful movement occur after at least 16 trading bars; half occur within 23 trading bars, and one-quarter require at least 32 trading bars.
The black dotted arrow represents median historical movement. Medians are a good metric, but they are just one of many I use when forecasting future movement.
As always, the stock could decline the very next bar after the signal without looking back (therefore the red boxes would not come into play) or the stock may never decline (and the green boxes may never come into play).


RSI flashing overbought for CDNABased on historical movement, the peak could occur anywhere in the larger red box. The final targets are in the green boxes. The pending bottom should occur within the larger green box as has been the historical case. Half of all movement has ended in the smaller green box. In this instance, the signal indicated SELL on August 25, 2021 with a closing price of 78.47.
If this instance is successful, that means the stock should decline to at least 76.99 which is the top of the larger green box. Three-quarters of all successful signals have the stock decline 3.886% from the signal closing price. This percentage is the top of the smaller green box. Half of all successful signals have the stock decline 10.0% which is the end point of the black dotted arrow. One-quarter of all successful signals have the stock decline 15.694% from the signal closing price which is the bottom of the smaller green box. The maximum decline on record would see a move to the bottom of the larger green box. These are the same concepts for the levels in the red boxes as well.
The ends/vertical sides of the boxes are determined in a similar fashion. The trough of the decline can occur as soon as the next trading bar after signal close, while the max decline occurs within the limit of study at 40 trading bars after the signal. A 0.5% decline must occur over the next 40 trading bars in order to be considered a success. Three-quarters of successful movement occur after at least 10 trading bars; half occur within 25 trading bars, and one-quarter require at least 31 trading bars.
The black dotted arrow represents median historical movement. Medians are a good metric, but they are just one of many I use when forecasting future movement.
As always, the stock could decline the very next bar after the signal without looking back (therefore the red boxes would not come into play) or the stock may never decline (and the green boxes may never come into play).


$CDNA Cup with Handle or Bull Flag?Looks to me that one can make an argument for either or both a cup with handle or bull flag formation on $CDNA. I've had my eye on this one for awhile and simply never pulled the trigger. Now it looks to be setting up to break-out of this formation. I'll be looking for an early entry once the price closes above the handle or flag formation. As the economy opens I expect this medical stock to do well. Ideas, not investing / trading advice.
from earningswhispers.com
Reported May 5.
CareDx Raises Guidance
Caredx (CDNA) reported a 1st Quarter March 2021 loss of $0.01 per share on revenue of $67.4 million. The consensus estimate was a loss of $0.14 per share on revenue of $61.1 million. Revenue grew 75.6% on a year-over-year basis.
The company said it expects 2021 revenue of $270.0 million to $280.0 million. The company's previous guidance was revenue of $255.0 million to $265.0 million and the current consensus revenue estimate is $260.92 million for the year ending December 31, 2021.
CareDx Inc is a commercial stage company that develops markets and delivers a diagnostic surveillance solution for heart transplant recipients to help clinicians make personalized treatment decisions throughout a transplant patient’s lifetime.

CDNA (CareDx, Inc.) - Bullish end to the QuarterCDNA
CareDx, Inc. is a commercial stage company. It develops, markets, and delivers a diagnostic surveillance solution for heart transplant recipients. The Company provides AlloMap, a noninvasive blood test used to aid in the identification of heart transplant recipients. It is also pursuing other areas of transplant surveillance, such as the use of cell-free DNA (cfDNA) as a biomarker for rejection. CareDx, Inc. is based in Brisbane, California.
Analysis/Commentary
Strong EPS and Sales Growth Y-on-Y
Based on the study of the previous quarterly earnings reports and subsequent price moves:
- Shaky start to the first half of the quarter
- Room for a return to at least the LOW point
- Trailing stop-loss on price above LOW point
GOOD LUCK.
DO YOUR OWN RESEARCH!

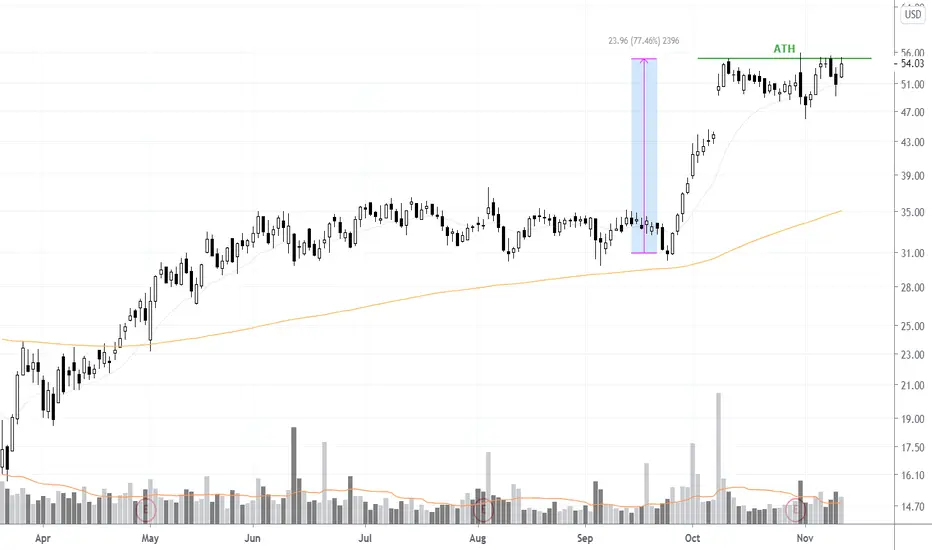
$CNDA Potential #Breakout SetupNASDAQ:CDNA been moving sideways consolidating its 77% gain from the September rally. The stock looks ready to break to ATHs and starts the next leg higher.
$CDNA can rise in the next daysContextual immersion trading strategy idea.
CareDx, Inc., a precision medicine company, discovers, develops, and commercializes healthcare solutions for transplant patients and caregivers worldwide.
The share price rose after the company preannounced preliminary revenue of about $53 million for the three months ended Sept. 30, 2020, up 57% year-over-year. This came in ahead of the $44.68-million consensus estimate.
The demand for shares of the company still looks higher than the supply.
These and other conditions can cause a rise in the share price in the next days.
So I opened a long position from $53,96;
stop-loss — $50,36.
Information about take-profits will be later.
Do not view this idea as a recommendation for trading or investing. It is published only to introduce my own vision.
Always do your own analysis before making deals. When you use any materials, do not rely on blind trust.
You should remember that isolated deals do not give systematic profit, so trade/invest using a developed strategy.
If you like my content, you can subscribe to the news and receive my fresh ideas.
Thanks for being with me!

CDNA simple but effective patternNice large falling wedge, nice breakout and was even up yesterday when the rest of the market was selling off.

Bear flag? Bearish point of view?I'm just working on my charts don't mind me lol. Do you think we will reach wave 3 or will we fall short? It looks like we are going to break out of this bear flag soon. Any advice or different ides, please let me know! Thanks


CDNA MA MACD Histogram just turned positiveThis is a Bullish indicator signaling CDNA's price could rise from here. Traders may explore going long the stock or buying call options. I identified 45 similar cases where CDNA's MACD histogram became positive, and 34 of them led to successful outcomes. Odds of Success: 76%.


CDNA: Longmajor trendline break
look for a long setup,
wait for more bullish price action for confirmation
