CECO – Long Trade Setup!📈 🟢
Ticker: CECO Environmental Corp. (NASDAQ: CECO)
Chart: 30-Min Timeframe
Pattern: Trendline support + breakout continuation
🔹 Entry: $25.92 (retest near trendline & breakout zone)
🔹 Stop-Loss: $25.26 (below ascending trendline & consolidation)
🔹 Take Profits:
TP1: $26.94 – Previous resistance zone
TP2: $28.10 – Measured breakout target
⚖️ Risk-Reward Calculation:
– Risk/Share: $0.66
– Reward to TP2: $2.18
– R:R Ratio: ~1:3.3 ✅
🧠 Technical Highlights:
– Strong uptrend with rising volume
– Breakout and retest of horizontal resistance
– Holding above trendline with bullish momentum
CECO trade ideas

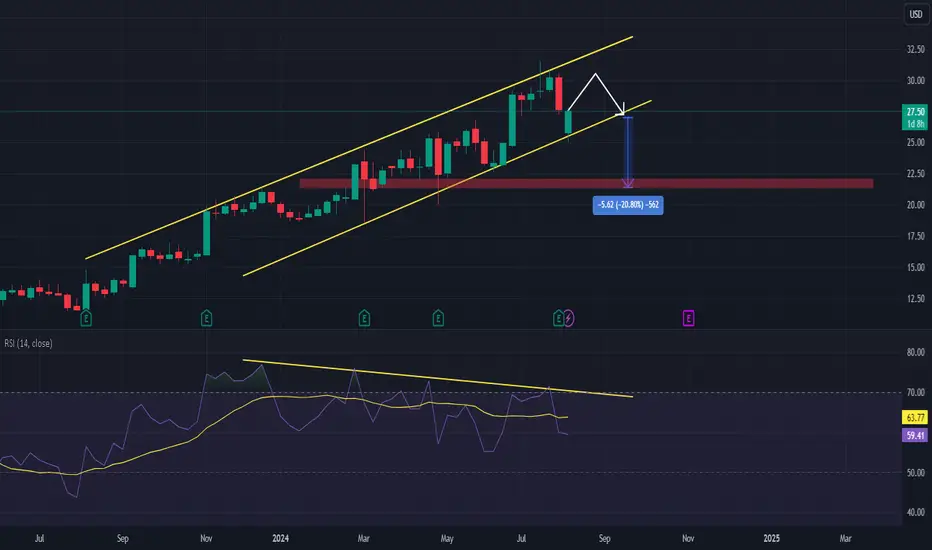
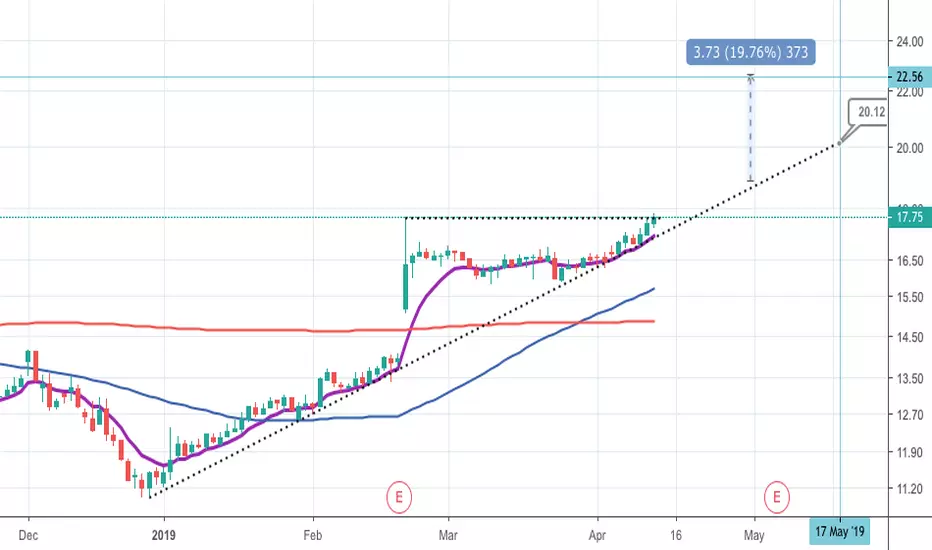
CECO Short PositionHi traders,
We are looking at a potential shorting opportunity for CECO. The stock is currently in an uptrend, but we are anticipating a correction based on bearish regular divergence observed on the weekly timeframe. Since this divergence alone doesn´t provide a strong sell signal, our strategy is to wait for a confirmed breakdown. When / if the breakdown occurs, target is short on the chart, we are expecting 20% move.
Good luck!
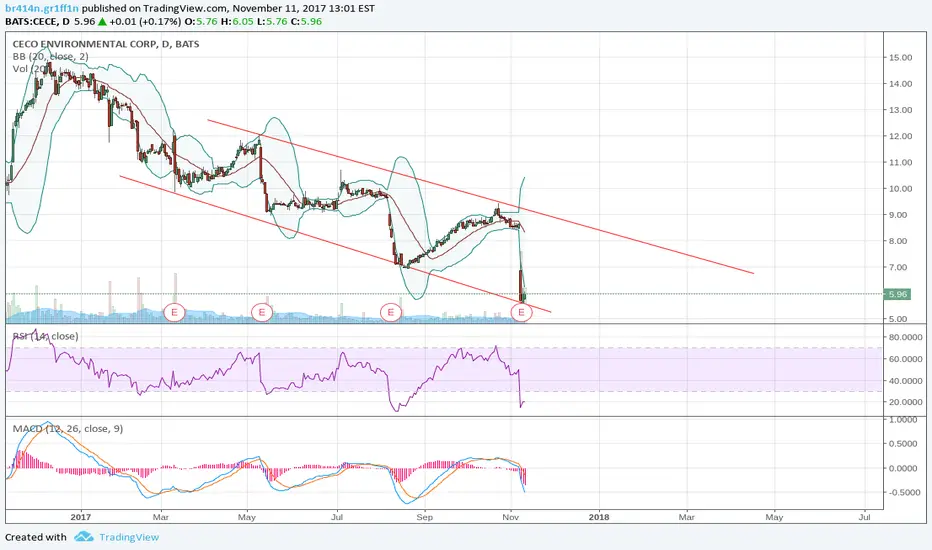
long term shortCECO riding a nice channel for the longest time. I wonder if a recession if one believes it will happen might decrease the demand for its products. On Fib 60% level at about $10, looks like an interesting place. Just an idea.

Uber-bearish Puts! Let's roll guys. This is a money-maker. CECO about to go Down like a lead zeppelin ... Buy at the Top, of the Channel; Sell the Puts at the bottom. What Could be easier

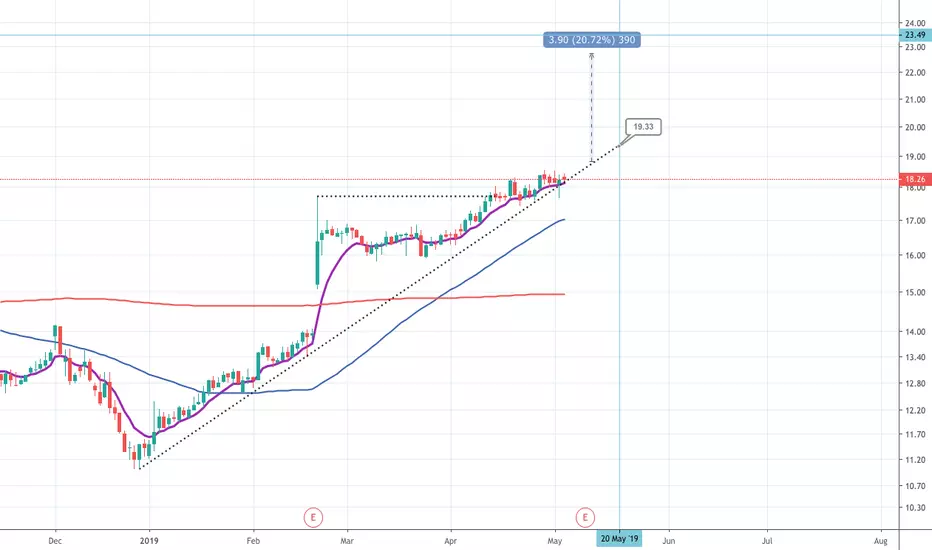
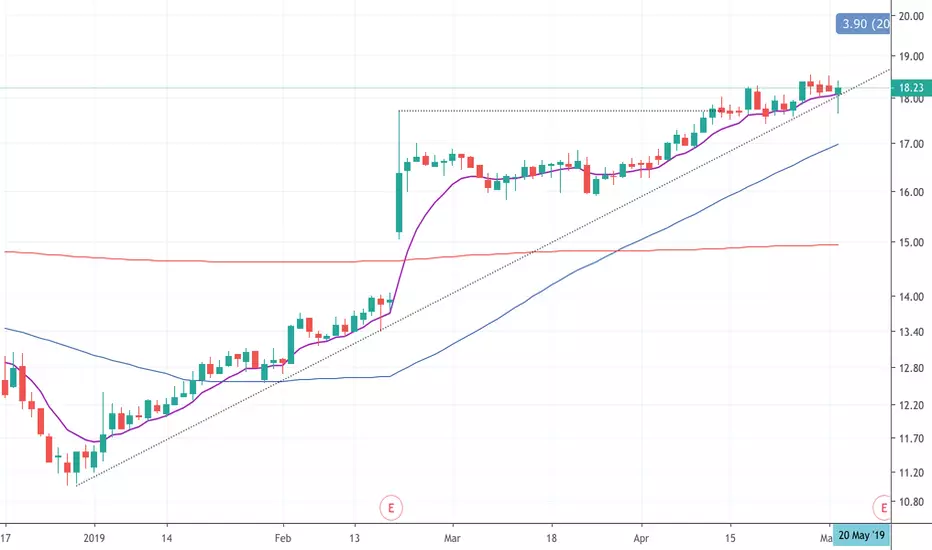
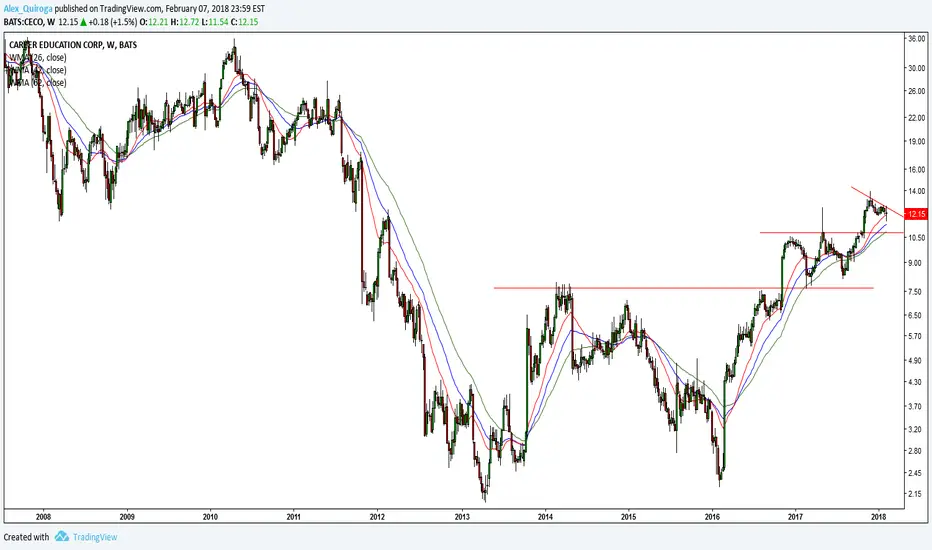
$CECE daily triangle, weekly triangle I view the daily chart as the ideal buy opportunity for the potential weekly triangle breakout. The way I'm thinking about it, am I willing to risk 5% (stop below 7.70) below the backtest of a now 4x tested trendline for a potentially massive weekly triangle breakout? To me that seems like an attractive offer. The other option is take some/all profit at a retest of the prior highs and given the low risk, the R/R is still quite good. Personally, if I enter the stock, I'll be looking for the weekly breakout, or I'll lose my 5% and move on.


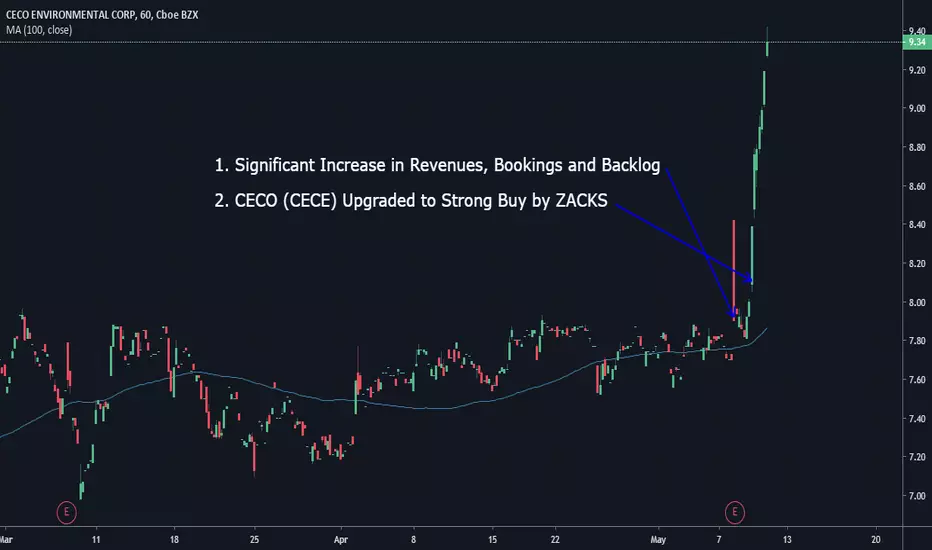
Let's get a Higher Education w/ $CECOThis stock entered my Over sold watchlist late last week and I was waiting for a little bounce back to ensure that a bottom had been represented. Opened up steaming today and again watched the 5m chart to ensure proper entrance after first dip and then bounce back.
Goals and price points are listed on the chart at multiple price levels to ensure profit that can be had in just a few days or even a few weeks.
S/L set at opening price way back on Feb. 21 at a Price Earnings Gap play.


Trending but not a bubble Experts say you need a trend to make money and even not need to use sophisticated tools only need a price correction and flow with the price.
My job is to find this kind of opportunities in the market and not just focus in the fashion of the moment, only because the dentist and the hairdresser are euphoric with Bit-coin this does not mean that me too. You do not learn nothing by following lemmings
This idea is for swing traders and need to be followed with the daily chart
Trading News ReleasesFor those who consider U.S. Major News Releases in trading, here are projections for the upcoming week's session:
** Projections ONLY **
GDP Growth Rate : From 2.6 to 2.0
Employment Rate : From 4.3 to 4.4
Inflation Rate : From 1.7 to 2.0
Interest Rate : From 1.25 to 1.25
Government Debt to GDP : From 106.10 to 106
Goods Trade Balance : From 43.6bn to 45.0bn / 46.6bn
Nonfarm Payrolls : From 209 to 165
Nonfarm Payrolls Private : From 205 to 192
ADP Employment Change : From 178 to 186
Personal Income : From 0.00 to 0.29
Consumer Confidence : From 97.6 to 95.0
Personal Spending : From 0.10 to 0.30
Personal Income : From 0.00 to 0.29
Building Permits : From 1230 to 1150
Housting Starts : From 1155 to 1190
New Home Sales : From 571 to 550
Pending Home Sales : From 0.50 to neg. 1.9
Existing Home Sales : From 5440 to 5500
Retail Sales MoM : From 0.60 to 0.30
NY Empire State Manufacturing Index : From 25.2 to 9
Ism New York Index : From 62.80 to 57.43
Dallas Fed Manufacturing Index : From 16.80 to 14.3
Chicago Fed National Activity Index : From neg. 0.01 to +0.09
Philadelphia Fed Mfg. Index : From 18.90 to 12
Richmond Fed Mfg. Index : From 14.00 to 6
Full list can be found via provided url link: tradingeconomics.com
* PERSONAL REFERENCE ONLY. Please use your own rules and strategies prior to entering market.
** Forex trading involves HIGH RISK.
Before entering a trade, carefully consider your objectives, financial resources and level of experience.


pennies to thousands long term above weekly cloudstrong in money flow and positive volume trend-good earnings--cci and percent r upper range-relative strength good above all key moving averages-stop loss back in cloud


Bullish Cup and Handle Poised to breakout. A lot may depend on Congress. Note July 10th vote: www.foxnews.com
