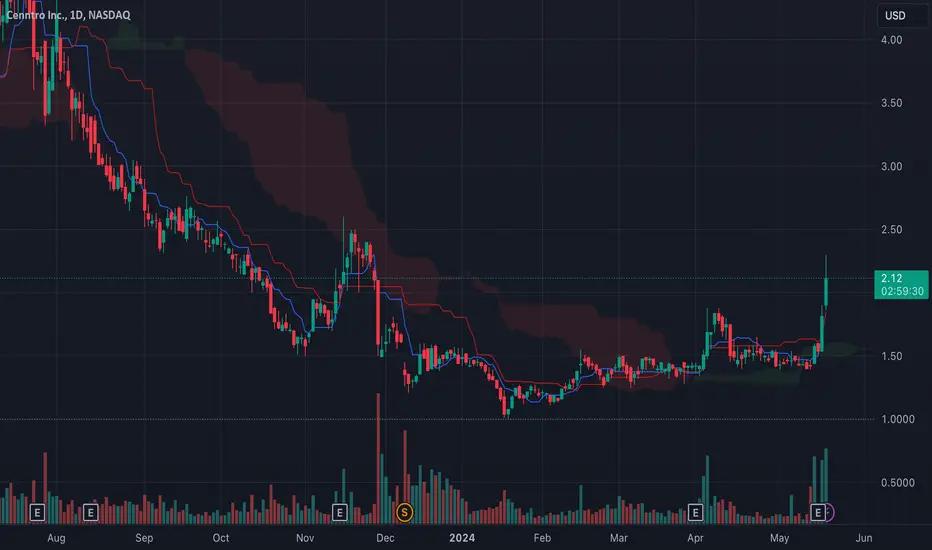
Technical Analysis of Cenntro Inc. (CENN) Cenntro Inc. (CENN) is experiencing a significant breakout with a surge in price and volume, currently trading at $2.13, reflecting an increase of 17.36%. This upward movement is characterized by substantial volume, indicating strong bullish sentiment.
Daily Candlestick Pattern: The recent candlestick shows a strong bullish engulfing pattern, breaking above the key resistance level of $2.00. This is supported by a noticeable increase in trading volume, suggesting a robust bullish momentum.
Moving Averages:
The 10-day EMA at $1.65 and the 20-day EMA at $1.58 have turned upwards, indicating a short-term bullish trend.
The stock has surpassed its 50-day and 200-day SMAs, which are at $1.51 and $1.84 respectively, confirming a potential long-term trend reversal.
Relative Strength Index (RSI): The RSI is currently at 78.75, indicating the stock is in overbought territory. This suggests potential for a short-term pullback but also signifies strong upward momentum.
Stochastic RSI: The Stoch RSI is extremely high at 92.46, further confirming the overbought condition. This might lead to minor corrections or consolidation in the near term.
Commodity Channel Index (CCI): The CCI at 438.65 suggests the stock is heavily overbought, supporting the potential for a short-term correction.
Ichimoku Cloud: The price has broken above the Ichimoku Cloud, with a bullish crossover between the conversion and baseline lines. The future cloud is also bullish, indicating sustained upward momentum.
Support Levels:
Immediate support is seen at $1.84 (Ichimoku base line and previous resistance).
Strong support at $1.60, coinciding with the recent consolidation zone.
Resistance Levels:
Immediate resistance is at $2.25, a previous high and a psychological barrier.
The next significant resistance is around $2.66, followed by $3.00.
Price Targets:
Short-term target: $2.25 (immediate resistance).
Medium-term target: $2.66 (previous high).
Long-term speculative target: $3.00, assuming continued bullish momentum and favorable market conditions.
Trading Strategy
Long Position:
Entry: Consider entering a long position if the price sustains above $2.00 with strong volume, or on a pullback to the $1.84 support level.
Stop Loss: Set a stop loss at $1.60 to manage downside risk.
Targets:
First target at $2.25.
Second target at $2.66.
Trailing stop could be used to lock in profits as the price moves higher.
Short Position:
Entry: A short position might be considered if there is a bearish reversal pattern or if the price fails to hold above $2.00, particularly if accompanied by decreasing volume.
Stop Loss: Set a stop loss at $2.25 to protect against a sudden bullish breakout.
Targets:
First target at $1.84.
Second target at $1.60, the strong support zone.
Given the overbought conditions indicated by RSI and Stoch RSI, traders should be cautious of potential short-term pullbacks. However, the overall bullish sentiment and strong volume suggest that any pullbacks may present buying opportunities rather than a reversal. It is essential to monitor market news and earnings announcements closely, as these can significantly impact price action.
Conclusion
Cenntro Inc. (CENN) presents a promising long opportunity given the current breakout above key resistance levels and the strong bullish indicators across multiple technical tools. Traders should look for entry points on pullbacks to support levels with well-defined stop losses and targets to maximize potential gains while managing risks effectively. The overall technical setup suggests a bullish outlook with potential for significant upside, making it an attractive candidate for both short-term trading and long-term investment strategies.
CENN trade ideas

Technical Analysis of Cenntro Inc. (CENN) Cenntro Inc. (CENN) is experiencing a significant breakout with a surge in price and volume, currently trading at $2.13, reflecting an increase of 17.36%. This upward movement is characterized by substantial volume, indicating strong bullish sentiment.
Daily Candlestick Pattern: The recent candlestick shows a strong bullish engulfing pattern, breaking above the key resistance level of $2.00. This is supported by a noticeable increase in trading volume, suggesting a robust bullish momentum.
Moving Averages:
The 10-day EMA at $1.65 and the 20-day EMA at $1.58 have turned upwards, indicating a short-term bullish trend.
The stock has surpassed its 50-day and 200-day SMAs, which are at $1.51 and $1.84 respectively, confirming a potential long-term trend reversal.
Relative Strength Index (RSI): The RSI is currently at 78.75, indicating the stock is in overbought territory. This suggests potential for a short-term pullback but also signifies strong upward momentum.
Stochastic RSI: The Stoch RSI is extremely high at 92.46, further confirming the overbought condition. This might lead to minor corrections or consolidation in the near term.
Commodity Channel Index (CCI): The CCI at 438.65 suggests the stock is heavily overbought, supporting the potential for a short-term correction.
Ichimoku Cloud: The price has broken above the Ichimoku Cloud, with a bullish crossover between the conversion and baseline lines. The future cloud is also bullish, indicating sustained upward momentum.
Support Levels:
Immediate support is seen at $1.84 (Ichimoku base line and previous resistance).
Strong support at $1.60, coinciding with the recent consolidation zone.
Resistance Levels:
Immediate resistance is at $2.25, a previous high and a psychological barrier.
The next significant resistance is around $2.66, followed by $3.00.
Price Targets:
Short-term target: $2.25 (immediate resistance).
Medium-term target: $2.66 (previous high).
Long-term speculative target: $3.00, assuming continued bullish momentum and favorable market conditions.
Trading Strategy
Long Position:
Entry: Consider entering a long position if the price sustains above $2.00 with strong volume, or on a pullback to the $1.84 support level.
Stop Loss: Set a stop loss at $1.60 to manage downside risk.
Targets:
First target at $2.25.
Second target at $2.66.
Trailing stop could be used to lock in profits as the price moves higher.
Short Position:
Entry: A short position might be considered if there is a bearish reversal pattern or if the price fails to hold above $2.00, particularly if accompanied by decreasing volume.
Stop Loss: Set a stop loss at $2.25 to protect against a sudden bullish breakout.
Targets:
First target at $1.84.
Second target at $1.60, the strong support zone.
Given the overbought conditions indicated by RSI and Stoch RSI, traders should be cautious of potential short-term pullbacks. However, the overall bullish sentiment and strong volume suggest that any pullbacks may present buying opportunities rather than a reversal. It is essential to monitor market news and earnings announcements closely, as these can significantly impact price action.
Conclusion
Cenntro Inc. (CENN) presents a promising long opportunity given the current breakout above key resistance levels and the strong bullish indicators across multiple technical tools. Traders should look for entry points on pullbacks to support levels with well-defined stop losses and targets to maximize potential gains while managing risks effectively. The overall technical setup suggests a bullish outlook with potential for significant upside, making it an attractive candidate for both short-term trading and long-term investment strategies.
CENN is breaking with price and volumeWatch out on this one. Currently in the 1.58 range and it might go up more after 1.60.


CENN in a bullish channel 🟢should see a nice bounce from trend support now, good risk reward for longs in my opinion.
stop loss at 1.55 with my targets at 1.87-2.21

Will history repeat itself?If Cenntro's sale number projections are legit (we'll see), they might see a bull run in future. As I told, there's still a gap around 200, this needs to be filled. However if CENN becomes 200 (for a second or minute) it will have a 50b market cap. Not sure if this is possible.

Third flagpoleIt seems to broke the trendline. Today a green day despite nasdaq was red. Monday PR is coming. It seems it's going for another run.

Cenn As I was buying this 2.24 level of support. 2.40 wa a key Chanel to brek through. We can see when we popped this channel momentum picked up. We are atempin to attack 2.50. It’s possible we get a pull back to the channel previous resiatnce and attempt to hold as new support. If we consildate between 2.37-2.40 area the next push will be beast. I’ll be tracking this next consildation closely to try to get an add in and raise my averge and also load more shares at a reasonable level if we hold previous resiatnce as new support. Smash the like if your in!

still bullish on 1ha massive sell-off happened after it was reached to 3. 2 could be the bottom for hourly rsi.

Cenn Higher risk play. I am loading up on these dips 2.25 and 2.24. Key resiatnce 2.40 could
Be basing here considlation before next move up. Might still take a week but as long as we remain above 2.18 I’m happy and will remain in

CennCenn 25-03-2022 last closing red candlesticks hammer Monday 28-03-22 i think will move up to $3.50 if cannot breakup $3.00 will move back down $1.86

CENNEntry when the shaded area is crossed and the targets are shown on the chart above and the stop loss is closed for a day candle below the blue line .

Cenntro Electric Group Limited (CENN)if breakup $2.60 will move to $4.95
if can't breakup $2.60 i think will go back $1.89 or $1.00

CENN ICHIMOKU CLOUDSCENN has been having really nice technical breakouts. The 1D IC could be the next test. That’s a 80% difference to the leading IC. CENN has a lot of momentum behind it being and EV for trucks and vans for commercial use.


Cenn buyLooking at CENN we could have a possibility of a nice profit as it climbs back to $8. It is making a nice turn around here on the weekly chart. However due to being below span A and showing a decline this can be an extremely likely maneuver. Rewarding if there is succes punishing if failed.

CENN looks great I think the CENN will start a new era next circular time.
It might break its latest high.
It is not a recommendation to buy. In contrast, it is a purpose of technical analysis.
Good luck to all.

CENN Premarket Breakthrough Cenntro Motors ticker $CENN has in this pocket last few months. It made an ATH the 2/24 and since then it has been testing floors and breaking through. With recently testing the BOLL and IC on the 1minute and 4 hours. It finally broke through and now making a run for the leading IC on the daily. With that quick of a drop and a lot of momentum in EVs, it’s very likely it can make more test $5 for the first time since it’s 1 for 15 reverse split.

Cenntro Motors Charting CENN has been on a very long down trend and have finally started to level off. It seems to have found support at $1.20 and resistance at $1.40. Now only that it have strong mac d cross on the 1-4 hour since the 15th. Ever since that sign of a reverse it has been testing the BOLL and IC on ever timeframe up to the daily. Right now it looks to be in price discovery. Will it go back into the pocket or will it trade to or through the resistance prices from the way down from $7. It looks super strong I’m the case that it will test those resistance areas and make test the previous floor of $7-$10. It is an EV that specializes in trucks and vans for companies. This type of products could lead to lot of sales as governments want to be fully electric predicted for the next decade.

CENN Hmmmmm Very InterestingLets have a look at what happened in November 2020 and compare the charts for CENN now. If we are about to make a move up, its going to happen this week... This move could even target $40+ by May.... Keeping an eye on it. If we break down lower than 0.99 then my initial thoughts of 0.04-0.16 are in play. I'm being on a weak DXY here, and if correct, CENN has a chance of upward momentum

$CENN Next Target PTs 2-3 and higher Cenntro Automotive Group, Inc. manufactures electric light and medium-duty commercial vehicles. The company was founded in 2013 and is based in Freehold, New Jersey.

$CENN Long Position I have identified a fallling wedge structure on the Cenntro daily chart and have considered a LONG position. Target is $2+
This would also represent a potential reversal pattern and confimation that the "bottom" might be in for CENN stock

$CENN - Cenntro Electric VehiclesUpdate on CENN - Still expecting my buy zone of $0.04-$0.16 to hit pretty dam soon. Ill be loading up with a long term bag when these prices come onto our screens.
