Update on $CG: Amazing run out of our Level 0 following the fast ema 9 and, as last the ema 50.
Huge correction expected here to create a healthy wave.
Next report date
—
Report period
—
EPS estimate
—
Revenue estimate
—
3.03 USD
1.02 B USD
5.29 B USD
255.16 M
About The Carlyle Group Inc.
Sector
Industry
CEO
Harvey Mitchell Schwartz
Website
Headquarters
Washington
Founded
1987
FIGI
BBG000BH3F20
The Carlyle Group, Inc. is a global investment firm. It operates through the following segments: Global Private Equity (GPE), Global Credit (GC), and Global Investment Solutions (GIS). The GPE segment focuses on buyout and growth capital funds, which pursue a variety of corporate investments of different sizes and growth potentials. The GC segment includes funds and vehicles that pursue investment strategies including loans and structured credit, direct lending, opportunistic credit, distressed credit, aircraft financing and servicing, infrastructure debt, insurance solutions, and global capital markets. The GIS segment provides comprehensive investment opportunities and resources for investors and clients to build private equity portfolios through fund of funds, secondary purchases or financings of existing portfolios, and managed co-investment programs. The company was founded by William Elias Conway Jr., Daniel Anthony D'Aniello, and David Mark Rubenstein in 1987 and is headquartered in Washington, DC.
Related stocks
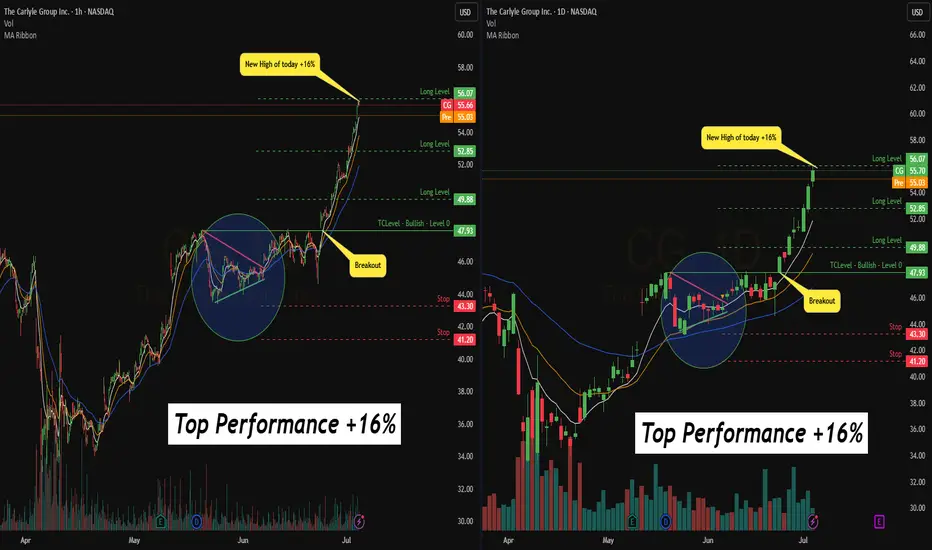
Quick View: $CG- Bullish crossover on the daily chart and bullish flag.
Area of $48 as key resistance.
Support → $43.5

CGThe Carlyle Group Inc. is an American multinational private equity, alternative asset management and financial services corporation based in the United States with $426 billion of assets under management. It specializes in private equity, real assets, and private credit.
A name via my screen. An ap

Massive huge buy volume spottedMassive huge buy volume spotted on weekly chart. Something is brewing.
Monthly chart and moving averages are pointing to an upward trend.

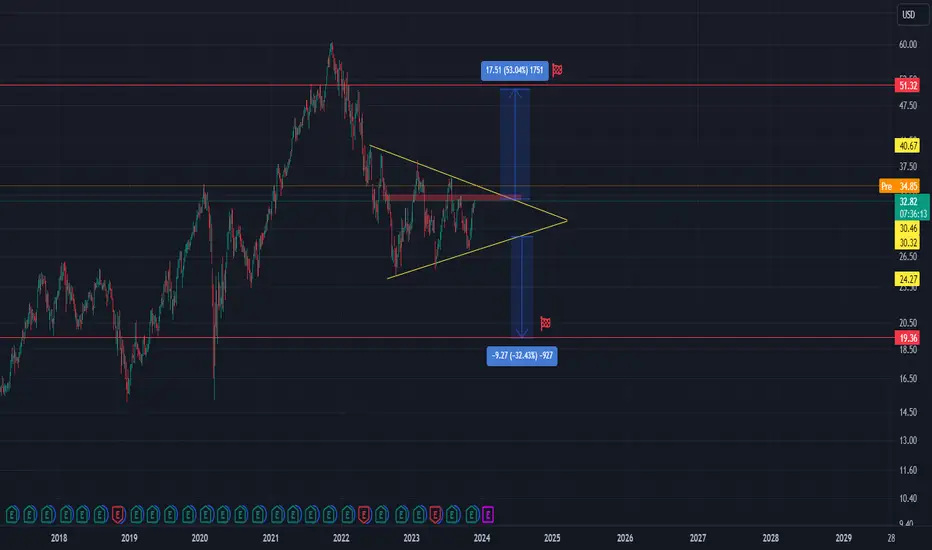
Carlyle Group Neutral Pattern Carlyle Group stock was named to join the S&P MidCap 400, effective prior to the start of trading November 30. Therefore I expect breaking of this symmetrical triangle pattern soon. In case there is a bullish break out from here, price target is 53% rise in price. On the other side there is still bi
LUCKILY THE TEST TACTIC SUSTAINEDIT TOOK MONTHS OF PREPARATION.
A LITTLE OVER A YEAR AGO... NOTICED VERY PECULIAR PATTERNS ON A LOT OF VERY STURDY CHARTS. EXAMINED NEARLY 400 TICKERS... SOMETHING VERY IMPORTANT STOOD OUT.
DID SOME CALCULATIONS AND TESTED THE THEORY WITH A LIVE PORTFOLIO.
WHEN THE BANKING CRISIS STARTED PACKING

CG - Head and Shoulders Idea showing a right shoulder forming on CG
This right shoulder takes price down to the green support line on the horizontal
The vertical line shows the head structure of the head and shoulder

$CG with a Bullish outlook following its earnings #Stocks The PEAD projected a Bullish outlook for $CG after a Negative over reaction following its earnings release placing the stock in drift C with an expected accuracy of 100%.

CG POSITIVE RSI DIVERGENCE WAVE B LOW THE positive r14 day rsi has now setup what i used to hear from one of my good friends and mentor the late peter deserio from ew land a BALLOON UNDER WATER tends to jump up and out of the water !!!

CG and TROW charts MOVE TO 100 % net long wave C rally The other day I covered ALL short and all puts as the market reached a very very over sold level in just 5 trading days I made a PROFIT based on the move from 90 to 110 % short at 4244 to 4285 area and took the profit . simple reason the MCO model was at a level I could not be short in

See all ideas
Summarizing what the indicators are suggesting.
Neutral
SellBuy
Strong sellStrong buy
Strong sellSellNeutralBuyStrong buy
Neutral
SellBuy
Strong sellStrong buy
Strong sellSellNeutralBuyStrong buy
Neutral
SellBuy
Strong sellStrong buy
Strong sellSellNeutralBuyStrong buy
An aggregate view of professional's ratings.
Neutral
SellBuy
Strong sellStrong buy
Strong sellSellNeutralBuyStrong buy
Neutral
SellBuy
Strong sellStrong buy
Strong sellSellNeutralBuyStrong buy
Neutral
SellBuy
Strong sellStrong buy
Strong sellSellNeutralBuyStrong buy
Displays a symbol's price movements over previous years to identify recurring trends.
C
CG3988359
Carlyle Holdings II Finance LLC 5.625% 30-MAR-2043Yield to maturity
5.81%
Maturity date
Mar 30, 2043
C
CG4881185
Carlyle Finance Subsidiary LLC 3.5% 19-SEP-2029Yield to maturity
4.55%
Maturity date
Sep 19, 2029
C
CG4104683
Carlyle Holdings II Finance LLC 5.625% 30-MAR-2043Yield to maturity
—
Maturity date
Mar 30, 2043
See all CG bonds
Frequently Asked Questions
The current price of CG is 58.71 USD — it has decreased by −3.21% in the past 24 hours. Watch The Carlyle Group Inc. stock price performance more closely on the chart.
Depending on the exchange, the stock ticker may vary. For instance, on NASDAQ exchange The Carlyle Group Inc. stocks are traded under the ticker CG.
CG stock has fallen by −6.42% compared to the previous week, the month change is a 11.26% rise, over the last year The Carlyle Group Inc. has showed a 18.61% increase.
We've gathered analysts' opinions on The Carlyle Group Inc. future price: according to them, CG price has a max estimate of 75.00 USD and a min estimate of 54.00 USD. Watch CG chart and read a more detailed The Carlyle Group Inc. stock forecast: see what analysts think of The Carlyle Group Inc. and suggest that you do with its stocks.
CG stock is 6.59% volatile and has beta coefficient of 1.80. Track The Carlyle Group Inc. stock price on the chart and check out the list of the most volatile stocks — is The Carlyle Group Inc. there?
Today The Carlyle Group Inc. has the market capitalization of 21.20 B, it has decreased by −0.53% over the last week.
Yes, you can track The Carlyle Group Inc. financials in yearly and quarterly reports right on TradingView.
The Carlyle Group Inc. is going to release the next earnings report on Aug 6, 2025. Keep track of upcoming events with our Earnings Calendar.
CG earnings for the last quarter are 1.14 USD per share, whereas the estimation was 0.95 USD resulting in a 19.38% surprise. The estimated earnings for the next quarter are 0.89 USD per share. See more details about The Carlyle Group Inc. earnings.
The Carlyle Group Inc. revenue for the last quarter amounts to 973.10 M USD, despite the estimated figure of 992.39 M USD. In the next quarter, revenue is expected to reach 904.67 M USD.
CG net income for the last quarter is 130.00 M USD, while the quarter before that showed 210.90 M USD of net income which accounts for −38.36% change. Track more The Carlyle Group Inc. financial stats to get the full picture.
Yes, CG dividends are paid quarterly. The last dividend per share was 0.35 USD. As of today, Dividend Yield (TTM)% is 2.38%. Tracking The Carlyle Group Inc. dividends might help you take more informed decisions.
As of Aug 2, 2025, the company has 2.3 K employees. See our rating of the largest employees — is The Carlyle Group Inc. on this list?
EBITDA measures a company's operating performance, its growth signifies an improvement in the efficiency of a company. The Carlyle Group Inc. EBITDA is 1.75 B USD, and current EBITDA margin is 32.04%. See more stats in The Carlyle Group Inc. financial statements.
Like other stocks, CG shares are traded on stock exchanges, e.g. Nasdaq, Nyse, Euronext, and the easiest way to buy them is through an online stock broker. To do this, you need to open an account and follow a broker's procedures, then start trading. You can trade The Carlyle Group Inc. stock right from TradingView charts — choose your broker and connect to your account.
Investing in stocks requires a comprehensive research: you should carefully study all the available data, e.g. company's financials, related news, and its technical analysis. So The Carlyle Group Inc. technincal analysis shows the neutral today, and its 1 week rating is buy. Since market conditions are prone to changes, it's worth looking a bit further into the future — according to the 1 month rating The Carlyle Group Inc. stock shows the buy signal. See more of The Carlyle Group Inc. technicals for a more comprehensive analysis.
If you're still not sure, try looking for inspiration in our curated watchlists.
If you're still not sure, try looking for inspiration in our curated watchlists.