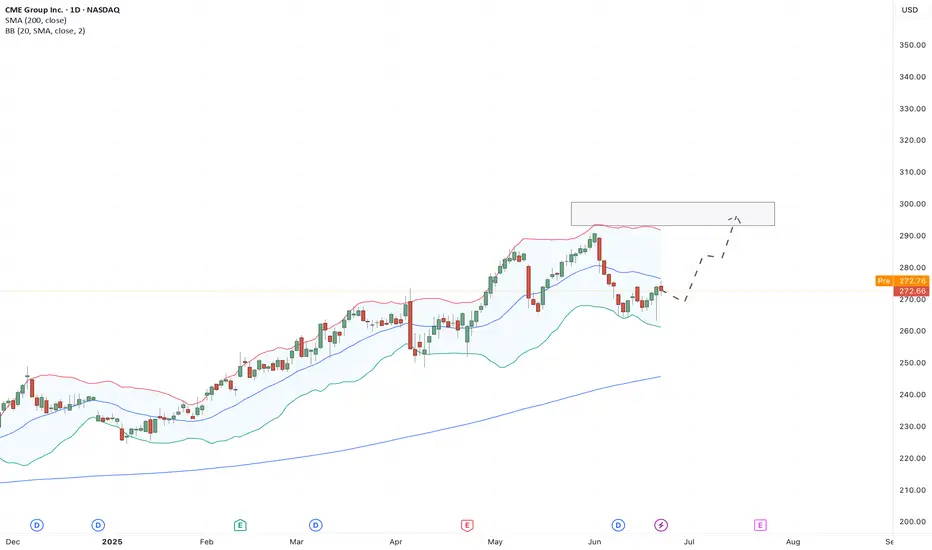
This may look like a repost of yesterday's idea - it's not.As tempting as it was today to choose TSLA and profit from the middle school girl drama that is Elon and DJT today, I’ll wait until the dust settles on that one to profit from it. Yes, the chart here for CME looks almost identical to the one for TW in the idea I posted yesterday. Hopefully, the ou
Key facts today
Next report date
—
Report period
—
EPS estimate
—
Revenue estimate
—
10.35 USD
3.53 B USD
6.13 B USD
358.83 M
About CME Group Inc.
Sector
Industry
CEO
Terrence A. Duffy
Website
Headquarters
Chicago
Founded
1898
FIGI
BBG000BHLYP4
CME Group Inc., through its exchanges, provides products across all asset classes, including futures and options based on interest rates, equity indexes, foreign exchange, energy, agricultural products and metals. The Company's segment primarily consists of the Chicago Mercantile Exchange Inc. (CME), Board of Trade of the City of Chicago, Inc. (CBOT), New York Mercantile Exchange, Inc. (NYMEX) and Commodity Exchange, Inc. (COMEX) exchanges. The Company provides electronic trading around the globe on its CME Globex platform. The Company also offers clearing and settlement services across asset classes for exchange-traded and over-the-counter derivatives through its clearinghouses CME Clearing and CME Clearing Europe. It also provides hosting, connectivity and customer support for electronic trading through its co-location services. The Company's CME Direct platform offers side-by-side trading of exchange-listed and privately negotiated markets.
Related stocks

CME is at the pivot zoneCME Group posted $1.64 billion in revenue (+10% YoY) and $2.80 EPS, beating forecasts.
Net income surpassed $1 billion, and ADV rose 13% YoY to 29.8 million contracts, with record volumes across all major asset classes—including rates, equities, commodities, and crypto.
From a technical point of vi
CME eyes on $225: Major front with only scattered clouds above CME has been struggling up against a major resistance zone.
Golden Genesis plus Golden Cofid fibs in a tight confluence.
Break should run given only minor fibs for some distance above.
$ 225.53 - 226.56 is the immediate zone of interest.
$ 218.47 below is first support for SL protection.
$ 239.66 i

$CME with a bullish outlook following its earnings #StocksThe PEAD projected a bullish outlook for NASDAQ:CME after a negative over reaction following its earnings release placing the stock in drift C with an expected accuracy of 80%.

CME to $209MODs have suggested that I provide more detail about the picks I make.
Sorry. I'm not as verbose as y'all, and I don't like things to be complicated.
My trading system is very simple.
I buy or sell at top & bottom of parallel channels.
I confirm when price hits Fibonacci levels.
Bonus if a TTM

CME 1H Long Swing Aggressive CounterTrend TradeAggressive CounterTrend Trade
- short impulse
+ biggest volume T1 level
+ biggest volume 2Sp-
+ weak test
+ first bullish bar closed entry
Calculated affordable stop limit
Takle profit:
+ 1/3 1 to 2 R/R
+ 1/3 to a Daily CREEK
+ 1/3 to a monthly 1/2
Daily Context
"- short balance
- unvolumed ICE l

New Product Launch: How to Use TradingView OptionsWe’ve rolled out our newest product and we’re eager to brag about it! It’s an options platform — TradingView Options. More precisely, it’s a powerful set of tools for options traders who want to keep a close eye on every little detail and fine-tune their strategy to perfection.
What Are Options?

Strong Momentum - 230 Initial TargetCME has a bullish setup that I've traded with success numerous times in the past. It repeats this pattern a lot.
Buy Zone = 217 - 221 (current level); Breakout level = 222
- Initial Target = 230 by 3/15/2024
- Then expect pullback to test 222-224 for support
- After that it will make a final leg h

CME Entry, Volume, Target, Stop
Entry: with price above 221.77
Volume: with volume greater than 1.77M
Target: 230.73 area. This is an area, you might consider existing early if price drops below a significant moving average such as the 10, 20, or 50 EMA. You might also considering holding some portion of the trade longer

Pro Trader Patterns for Swing TradingThis important exchange has been doing very well with options and futures contract sales.
NASDAQ:CME had a classic pre-earnings run up fueled by professional traders swing trading, out of a platform support level.
The retracement was only a sympathy move with retail knee-jerk reactions due to

See all ideas
Summarizing what the indicators are suggesting.
Neutral
SellBuy
Strong sellStrong buy
Strong sellSellNeutralBuyStrong buy
Neutral
SellBuy
Strong sellStrong buy
Strong sellSellNeutralBuyStrong buy
Neutral
SellBuy
Strong sellStrong buy
Strong sellSellNeutralBuyStrong buy
An aggregate view of professional's ratings.
Neutral
SellBuy
Strong sellStrong buy
Strong sellSellNeutralBuyStrong buy
Neutral
SellBuy
Strong sellStrong buy
Strong sellSellNeutralBuyStrong buy
Neutral
SellBuy
Strong sellStrong buy
Strong sellSellNeutralBuyStrong buy
Displays a symbol's price movements over previous years to identify recurring trends.
US12572QAH8
CME GROUP 18/48Yield to maturity
5.92%
Maturity date
Jun 15, 2048
CME4048080
CME Group Inc. 5.3% 15-SEP-2043Yield to maturity
5.35%
Maturity date
Sep 15, 2043
US12572QAK1
CME GROUP 22/32Yield to maturity
4.77%
Maturity date
Mar 15, 2032
CME6020518
CME Group Inc. 4.4% 15-MAR-2030Yield to maturity
4.36%
Maturity date
Mar 15, 2030
CME4645476
CME Group Inc. 3.75% 15-JUN-2028Yield to maturity
4.14%
Maturity date
Jun 15, 2028
See all CME bonds
Curated watchlists where CME is featured.

Frequently Asked Questions
The current price of CME is 279.34 USD — it has increased by 0.84% in the past 24 hours. Watch CME Group Inc. stock price performance more closely on the chart.
Depending on the exchange, the stock ticker may vary. For instance, on NASDAQ exchange CME Group Inc. stocks are traded under the ticker CME.
CME stock has risen by 1.31% compared to the previous week, the month change is a 0.88% rise, over the last year CME Group Inc. has showed a 41.65% increase.
We've gathered analysts' opinions on CME Group Inc. future price: according to them, CME price has a max estimate of 322.00 USD and a min estimate of 212.00 USD. Watch CME chart and read a more detailed CME Group Inc. stock forecast: see what analysts think of CME Group Inc. and suggest that you do with its stocks.
CME stock is 1.73% volatile and has beta coefficient of 0.10. Track CME Group Inc. stock price on the chart and check out the list of the most volatile stocks — is CME Group Inc. there?
Today CME Group Inc. has the market capitalization of 100.09 B, it has increased by 0.84% over the last week.
Yes, you can track CME Group Inc. financials in yearly and quarterly reports right on TradingView.
CME Group Inc. is going to release the next earnings report on Oct 22, 2025. Keep track of upcoming events with our Earnings Calendar.
CME earnings for the last quarter are 2.96 USD per share, whereas the estimation was 2.91 USD resulting in a 1.58% surprise. The estimated earnings for the next quarter are 2.71 USD per share. See more details about CME Group Inc. earnings.
CME Group Inc. revenue for the last quarter amounts to 1.69 B USD, despite the estimated figure of 1.69 B USD. In the next quarter, revenue is expected to reach 1.57 B USD.
CME net income for the last quarter is 1.02 B USD, while the quarter before that showed 949.90 M USD of net income which accounts for 7.16% change. Track more CME Group Inc. financial stats to get the full picture.
Yes, CME dividends are paid quarterly. The last dividend per share was 1.25 USD. As of today, Dividend Yield (TTM)% is 3.82%. Tracking CME Group Inc. dividends might help you take more informed decisions.
CME Group Inc. dividend yield was 4.48% in 2024, and payout ratio reached 107.52%. The year before the numbers were 4.58% and 108.90% correspondingly. See high-dividend stocks and find more opportunities for your portfolio.
As of Jul 31, 2025, the company has 3.76 K employees. See our rating of the largest employees — is CME Group Inc. on this list?
EBITDA measures a company's operating performance, its growth signifies an improvement in the efficiency of a company. CME Group Inc. EBITDA is 4.54 B USD, and current EBITDA margin is 69.63%. See more stats in CME Group Inc. financial statements.
Like other stocks, CME shares are traded on stock exchanges, e.g. Nasdaq, Nyse, Euronext, and the easiest way to buy them is through an online stock broker. To do this, you need to open an account and follow a broker's procedures, then start trading. You can trade CME Group Inc. stock right from TradingView charts — choose your broker and connect to your account.
Investing in stocks requires a comprehensive research: you should carefully study all the available data, e.g. company's financials, related news, and its technical analysis. So CME Group Inc. technincal analysis shows the strong buy rating today, and its 1 week rating is buy. Since market conditions are prone to changes, it's worth looking a bit further into the future — according to the 1 month rating CME Group Inc. stock shows the buy signal. See more of CME Group Inc. technicals for a more comprehensive analysis.
If you're still not sure, try looking for inspiration in our curated watchlists.
If you're still not sure, try looking for inspiration in our curated watchlists.