Conduent launches contactless payment system in Venice transportConduent Incorporated (NASDAQ: CNDT), a developer of business software solutions, has successfully launched a contactless payment system for Venice’s public transport network. This development places Conduent at the forefront of the expanding market for contactless payment solutions, particularly in high-traffic tourist locations.
The newly implemented system, which took several months to deploy, can support a wide range of contactless payment methods, including bank cards, digital wallets, and NFC-enabled devices. Given that Venice attracts approximately 180 million tourists annually who utilise river trams, taxis, ferries, and personal vehicles, this initiative is expected to capture a significant market share despite focusing on a single city.
Technical analysis of Conduent Incorporated (NASDAQ: CNDT)
Exploring potential investment opportunities, let us review the technical aspects of Conduent’s stock:
Timeframe : Daily (D1)
Current trend : there is an existing downtrend; however, a recent break above the resistance line indicates potential for a trend reversal
Resistance level : 3.65 USD
Support level : 3.00 USD
Current position : the stock is attempting to consolidate above the newly broken resistance
Potential downtrend target : if the downtrend resumes, the downside target could be set at 2.00 USD
Short-term target : if the uptrend continues and the stock breaks through the resistance at 3.65 USD, a short-term target could be 4.95 USD
Medium-term target : should the upward momentum be sustained, the price might rise to 6.30 USD
Investors should closely monitor Conduent’s performance, particularly how the market responds to Venice’s new contactless payment system. This project could significantly influence Conduent’s market presence and financial success in transportation.
—
Ideas and other content presented on this page should not be considered as guidance for trading or an investment advice. RoboMarkets bears no responsibility for trading results based on trading opinions described in these analytical reviews.
The material presented and the information contained herein is for information purposes only and in no way should be considered as the provision of investment advice for the purposes of Investment Firms Law L. 87(I)/2017 of the Republic of Cyprus or any other form of personal advice or recommendation, which relates to certain types of transactions with certain types of financial instruments.
Risk Warning: CFDs are complex instruments and come with a high risk of losing money rapidly due to leverage. 69.88% of retail investor accounts lose money when trading CFDs with this provider. You should consider whether you understand how CFDs work and whether you can afford to take the high risk of losing your money.
CNDT trade ideas

CNDT Conduent Incorporated Following the breakout in end-2023 from the diagonally-downward sloping channel dating back from mid-2021, the share price found resistance at the 0.236 fib level. Proceeding this, another fib could be drawn to identify the next support level. Everything indicates that support will be found at 0.382 fib level of the latter mentioned fib, this also coinciding with the recently drawn support line.
One can also note that a bull flag pattern is in the works, with the pole dating from mid-November 2023 until end-December 2023 and the flag from the latter and still ongoing.
Although the MACD did not yet cross the signal from below, it is only a matter of time.
The 50 SMA recently crossed from below the 200 SMA, and the share price seems to have found support at the 50 SMA.
RSI stands at 42 so it is in mid range.
The company also has a solid P/FCF and P/B.
1st price target: 3.90
2nd price target: 4.18


CNDT LongRecent MACD cross and ADX is rising over 18 suggesting a strengthening trend and the D+ showing a sharp move up show us it is a positive trend.
The series of higher lows and the gap up to close above the .50 fib level and descending trend line is very bullish.
OBV confirms the trend.
targets: 4.82, 5.16, 6.06

CNDT BullishThe MACD is crossing over and after making a double bottom the price recently broke above the descending weekly trend line. We also see D+ curling up and D- crossing bellow the ADX line which implies an uptrend.
It appears that 4.70 may act as resistance in the short term given the congestion at that price, which is also the .38 fib level.
target: 4.96, 5.31, 5.63 in the short term.

Conduentwe wait the 5$ .. but if the price broken the trend line we can see again more suitable price ..

$CNDTBounce to resistance from support.
Daily MACD classic bullish divergence.
Stop = Below current support

CNDT Long SwingMACD is crossing and the price has consolidated for several days at the 4.96 level, which has acted as a key support/resistance level in the past.
The most recent candle tested the uptrend line which also the .382 fibonacci level.
targeting: 5.75 in the short term. $7 in the longer term.

Counduent, a goldmineAfter the separation from Xerox conduent days was all dark, at least for now conduent is a good company long-term they have hands on many sectors from Healthcare to transports (both public and private) and it is valuate at only 1B right now with a 4B revenue and its estimated to increase in the next 2 years.

CNDT - STRONG BUY!! Monthly chart Carl Icahn stock.....number for entitlements from Big Government will dramatically increase this year, they handle all welfare, SNAP, medicare payments, toll roads and many other services.

$CNDTDown-sloping wedge and at horizontal support
Entry is at the horizontal support
Target is the horizontal resistance
Stop is just below diagonal support but I will exit trade with a candle close underneath horizontal resistance

BUY CNDT - Conduent Incorporated - STRONG BUY ON WEEKLY CHARTBUY CNDT - Conduent Incorporated - STRONG BUY ON WEEKLY CHART

CNDT: Hitting the reversalI predict it will return to its price before the slight COVID drop and continue on an upward trend hitting a reversal.

CNDT ContinuationI am looking for CNDT to continue its slow rise as it meets resistance at 3.69 First target $4.10

CNDT Golden CrossWatching CNDT for a rally. The 50 SMA has recently crossed the 200 MA and the price closed above the .50 fib level. This could potentially take it back to prior highs in the next couple of weeks. Targeting 3.68 then 4.10

CNDT - looks bullish here Watching this one sihce earnings.
Looks like it has found a bottom and now breaking out from a bullish wedge.

CNDT Break OutCNDT looks like it could break out. The double bottom on 9/9 & 9/10 after the downtrend is bullish. Also i like the retest (3x) of the uptrend line. Break out over 3.67. First target 4.10

CNDT - $2.50/$2.20 BUYLooking to invest in Conduent Inc. if/when we return to the 50 day moving average
0.886 retracement in line with previous 2 moves
Forward P/E 7.45

CNDT, a quarterly gainer,rising +116.62%.Expect Uptrend reversalConduent (CNDT, $3.91) was one of top quarterly gainers, jumping +116.62% to $3.91 per share. Tickeron A.I.dvisor analyzed 142 stocks in the Miscellaneous Commercial Services Industry over the last three months, and discovered that 135 of them (94.9%) charted an Uptrend while 7 of them (5.1%) trended down. Tickeron A.I.dvisor found 109 similar cases when CNDT's price went up 15% within three months. Tickeron AI shows that in 77 out of those 109 cases, CNDT's price went down during the following month. Based on these historical data, Tickeron A.I. thinks the odds of an Uptrend reversal for CNDT are 71%.
Current price $3.76 crossed the support line at $4.34 and is trading between $4.34 support and $3.21 resistance lines. Throughout the month of 07/15/20 - 08/16/20, the price experienced a +77% Uptrend, while the week of 08/09/20 - 08/16/20 shows a -16% Downtrend.
The RSI Indicator appears to be shifting from an Uptrend to a Downtrend. Tickeron AI shows that in 14 of 19 cases where CNDT's RSI indicator exited the overbought zone, the price fell further within the following month. The odds of a continued Downtrend are 74%.
The higher Bollinger Band was broken -- a price fall is expected as the ticker heads toward the middle band, which invites the trader to consider selling or shorting the ticker, or exploring put options. Tickeron AI shows that in 16 of 23 cases where CNDT's price broke its higher Bollinger Band, its price dropped further during the following month. The odds of a continued Downtrend are 70%.


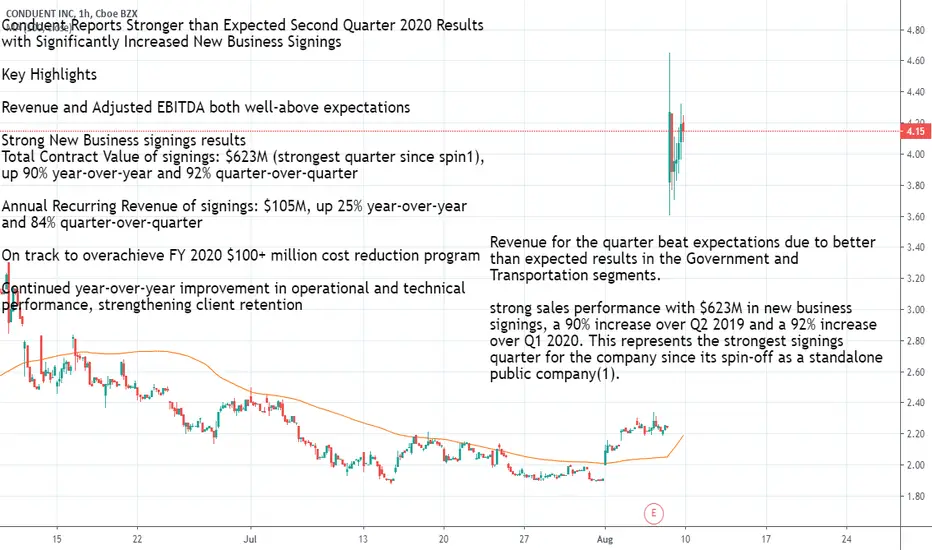
Stronger than Expected Second QuarterConduent Reports Stronger than Expected Second Quarter 2020 Results with Significantly Increased New Business Signings
Key Highlights
Revenue and Adjusted EBITDA both well-above expectations
Strong New Business signings results
Total Contract Value of signings: $623M (strongest quarter since spin1), up 90% year-over-year and 92% quarter-over-quarter
Annual Recurring Revenue of signings: $105M, up 25% year-over-year and 84% quarter-over-quarter
On track to overachieve FY 2020 $100+ million cost reduction program
Continued year-over-year improvement in operational and technical performance, strengthening client retention
Revenue for the quarter beat expectations due to better than expected results in the Government and Transportation segments.
strong sales performance with $623M in new business signings, a 90% increase over Q2 2019 and a 92% increase over Q1 2020. This represents the strongest signings quarter for the company since its spin-off as a standalone public company(1).
finance.yahoo.com
Conduent reported Q2 earnings per share at $0.12/share, which beat analyst predictions of $-0.05/share.
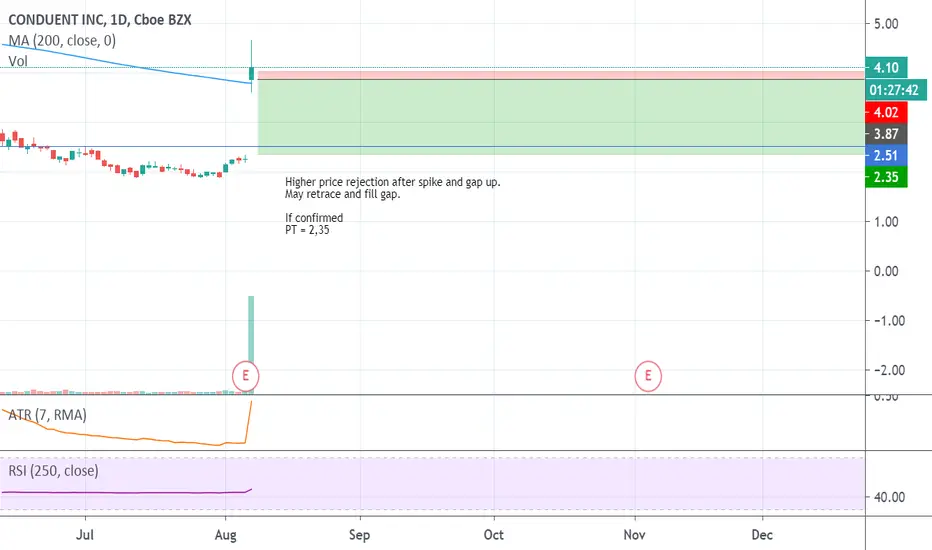
CNDT: Higher price rejection after gap up (watching)Higher price rejection after spike and gap up.
May retrace and fill gap.
If confirmed
PT = 2,35