Possible Continuation of a Bullish MoveThe M-15 chart shows a bounce on Friday AH session from within a strong area of support with multiple conjunctions including a rejection candle with a lower wick and closing above the 200 EMA/SMA lines.
This area is also represents a historic support that was retested with the rejection candle, thus indicating a false breakdown and a true reversal to the upside. Thus one can anticipate a continuation of the Bullish move that started earlier in that same day.
SL & PT:
The bottom of the move can therefore serve as a fair area of support and SL. There are multiple PT's, most notable are VWAP and the previous day high.
Wishing you the best of luck with your trading.
CNSP trade ideas

long to close the gapthere is a small completed falling wedge pattern that has been broken and tested.Cnsp is ready to jump to close 4.6 gap .
I am not advising you to buy or sell. this is what I have seen and i would like to share it to get a proper technical discussion.

CNS Pharmaceuticals broke resistance. CNSPWhich is a technical confirmation of an impulse in the direction preceding the crossing, invalidated by the crossing of the said level once in the opposite direction. Don't worry if that doesn't make any sense to you.
We are not in the business of getting every prediction right, no one ever does and that is not the aim of the game. The Fibonacci targets are highlighted in purple with invalidation in red. Confirmation level, where relevant, is a pink dotted, finite line. Fibonacci goals, it is prudent to suggest, are nothing more than mere fractally evident and therefore statistically likely levels that the market will go to. Having said that, the market will always do what it wants and always has a mind of its own. Therefore, none of this is financial advice, so do your own research and rely only on your own analysis. Trading is a true one man sport. Good luck out there and stay safe.

Possibly a Short Squeeze on the Way!Chart's pattern and its resistance at around current price make a sharp price change foreseeable.
Recommended for Midterm.

CNSP; Possible Swing Trader Action coming upDisclaimer
Standard disclaimer, not financial advisor, nor a wizard of the stonks. This is a basic chart analysis, CNSP had a solid catalyst previously that yielded nothing, meaning there is gas in the tank for any ride up. Either way, sitting nicely around bottom resistance band, which could be good, or if it dips below, it could signal a drastic investor shift in ideology.

Very Bullish near term, possible star in coming yearsPossible Elliot Wave formation, next catalyst could be the fifth point of the impulse!
Fundamentals are golden:
Institutional ownership has increased over last period, with no sells.
Float is ~15 million shares, short% is 3.45, Beta is 2.54, NASDAQ year end estimate is >8$/share.
CNSP is a clinical stage biotech that deals with Central Nervous System cancers, with goals for more than just cancer. It's clinical stage, meaning basic research is minimum. It looks like it has it's drug (Berubicin), and is just going to go forward with this in everything they can. There is strength to this, low overhead costs from basic research and drug pipeline development, making it an attractive target for acquisition or just commercialization on its own. However, after this company gets through clinical trials and gets to a deserved price, future growth outlook is low.
The drug Berubicin has 0 hits in scientific literature searches. My hypothesis is that this is a derivative made from a chemical library synthesis project on a doxorubicin/anthracycline base. This class of drugs have been used in cancer therapies for time immemorial, not excelling at specificity, but extending life-spans and increasing 5 year survival odds when combined with surgery or radiation therapy. The drug was likely a hit on tiered library screens, moving through pre-clinical trials, all the way through phase 1.
In phase 1 it had a 44% success rate! Phase 1 is merely for safety, not efficacy, meaning the drug dosages could have been far from optimal. This gives me huge confidence in positive phase 2, especially against competitors. The current "gold standard" for chemotherapeutic treatment of GBM (glioblastoma) is Temozolomide (TMZ), which has a 22-37% increase in 1 YEAR SURVIVAL RATES, or overall survival increase of 2 MONTHS. While the exact mechanism's of TMZ and Berubicin are very different, the strategy is induction of DNA damage, which has been a highly attractive target for pharmaceuticals in cancer research.
Without scientific research in journals, it is impossible to know the exact target of Berubicin, and it makes me uncomfortable about its odds of success in a large Phase 3/4 clinical trial, but I suspect Phase 2 will go well. Either of these is unimportant for the time being as there are 2 large catalysts on the horizon.
CNSP is going to an analyst conference today through Friday, meaning a fresh price evaluation could be in the near term. On top of this, their Phase 2 clinical trial that was approved begins officially March 31st. Matching the beat of other biotechs, I predict a PR stating they dosed their first patient, with a solid reaction from that.
I am bullish in the near term, will rely on phase 2 trial news before I make a long term prediction. Should get a sizable profit margin in the coming weeks. For reference, TMZ is the gold standard for GBM, leading brand Temodar had 423 million dollars in sales as of 2013 (looking for more current market info). If CNSP has something better, especially with the clinical trials working in combination with radioactive and surgery therapies, then I can see them taking over a large chunk of the market without a significantly larger benefit in survival periods. If the 44% holds true, CNSP could take over the GBM market, and their push into more CNS diseases/cancers that could benefit from Berubicin are only going to compound on this.
As always, please leave a comment with suggestions! I am looking to continue these types of ideas, and would love criticism to improve! Remember, I am in no way an analyst or financial advisor, I am just some schmuck looking to share my personal theories. Please do your own research, if only just to double check that I am not lying!

Long CNSP to $4.12 above 3.50Long CNSP to $4.12 above 3.50
CNSP has reentered a trading range if you look left.
Symmetrical triangle formation, in confluence with the 786 fib, and monthly resistance levels.
100% measured move on the possible breakout would put us near $4.20, and just under a historical closing range at $4.32
Possible targets above that would be the 1.618 fib at 4.66, or 5.27. All time highs would be 5.71
However, the RSI looks over extended on the 4HR and the macd implies buyers are exhausted
on the breakdown, i would look for support at the 786 fib at 3.35 or the 618 at 3.08
Beyond that weekly support would be 2.85 and not unrealistic that we would get a retest of support if we break to the downside.
Concluence with the 786 fib and the parallel trading channel in red, would imply we could find support at what used to be our monthly resistance.
If we fall out of that trading range, i would look for entry at 2.85 or 2.70

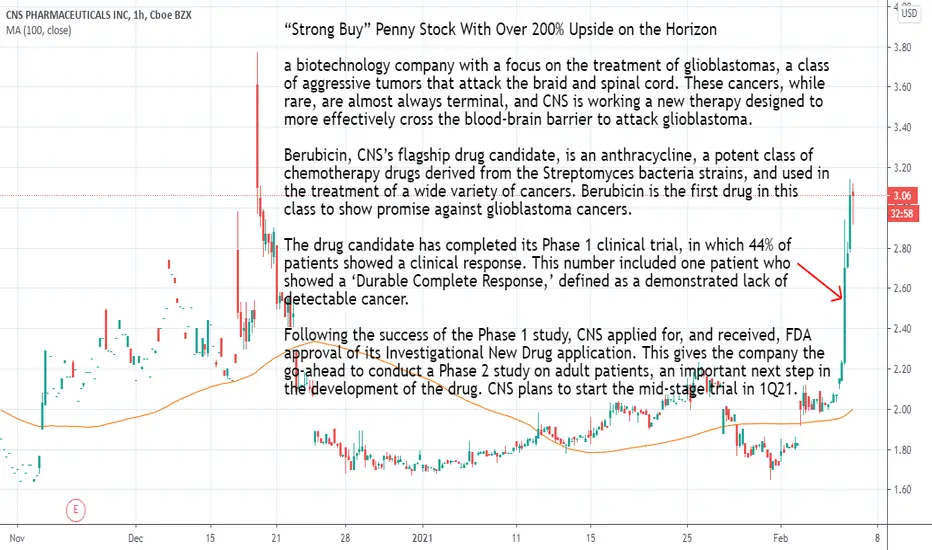
“Strong Buy” Penny Stock With Over 200% Upside on the Horizon“Strong Buy” Penny Stock With Over 200% Upside on the Horizon
a biotechnology company with a focus on the treatment of glioblastomas, a class of aggressive tumors that attack the braid and spinal cord. These cancers, while rare, are almost always terminal, and CNS is working a new therapy designed to more effectively cross the blood-brain barrier to attack glioblastoma.
Berubicin, CNS’s flagship drug candidate, is an anthracycline, a potent class of chemotherapy drugs derived from the Streptomyces bacteria strains, and used in the treatment of a wide variety of cancers. Berubicin is the first drug in this class to show promise against glioblastoma cancers.
The drug candidate has completed its Phase 1 clinical trial, in which 44% of patients showed a clinical response. This number included one patient who showed a ‘Durable Complete Response,’ defined as a demonstrated lack of detectable cancer.
Following the success of the Phase 1 study, CNS applied for, and received, FDA approval of its Investigational New Drug application. This gives the company the go-ahead to conduct a Phase 2 study on adult patients, an important next step in the development of the drug. CNS plans to start the mid-stage trial in 1Q21.
Based on the potential of the company’s asset in glioblastoma, and with its share price at $2.22, several analysts believe that now is the time to buy.
Among the bulls is Brookline’s 5-star analyst Kumaraguru Raja who takes a bullish stance on CNSP shares.
Berubicin is the first anthracycline to cross the blood-brain barrier in adults and access brain tumors… Berubicin has promising clinical data in a Phase 1 trial in recurrent glioblastoma (rGBM) and has Orphan drug designation for treatment of malignant gliomas from the FDA. We model approval of Berubicin for treatment of recurrent glioblastoma in 2025 based on the Phase 2 data with 55% probability of success for approval. We model peak sales of $533 million in 2032,” Raja opined.
“CNS pipeline also includes WP1244 (novel DNA binding agent) that is 500x more potent than daunorubicin in inhibiting tumor cell proliferation is expected to enter the clinic in 2021… In vivo testing in orthotopic models of brain cancer showed high uptake of WP1244 by brain and subsequent antitumor activity,” the analyst added.
finance.yahoo.com
CNSP "Bottom Play" - Conference coming and Phase 2 planned in Q1No Investment Advise!
Most information on the Chart
I do this only for practicing.
We might see 1.20 (all time Low) before we reverse.
Keep in mind there was an Offering at 2.00

CNSP - break outBreak out. Yes there is plenty of risk on this one. But looks really good for a small position, with potential for a big reward.
