COIN - FUTURE DECLINE The U.S. Securities and Exchange Commission (SEC) is not backing down in its legal battle against Coinbase Global (NASDAQ: COIN), a prominent cryptocurrency exchange. On Tuesday, the SEC made a firm move by requesting a federal judge to deny Coinbase's motion to dismiss the lawsuit that the regulator had filed against the platform. This development marks a critical moment in the ongoing dispute between the regulatory body and one of the cryptocurrency industry's major players.
Risk Disclosure: Trading Foreign Exchange (Forex) and Contracts of Difference (CFD's) carries a high level of risk. By registering and signing up, any client affirms their understanding of their own personal accountability for all transactions performed within their account and recognizes the risks associated with trading on such markets and on such sites. Furthermore, one understands that the company carries zero influence over transactions, markets, and trading signals, therefore, cannot be held liable nor guarantee any profits or losses.
COIN trade ideas
Coinbase may go up to 157 until 2023.11.7Coinbase may go up to 157 until 2023.11.7 or it will retrace to 53 firstly.
because coinbase is running in the tunnel, 157 is the up edge and the 0.618(0.382) of Fibonacci position.
If it retrace, then the last low(55) is the position I will buy.

Coinbase Textbook Bottoming Pattern Found Hi Guys! This is a Technical Analysis of Coinbase (COIN) on the 1 week timeframe.
As you can see we have drawn out a Inverse Head & Shoulder Pattern forming in COIN.
This is a textbook pattern as it follows to the t the necessary criteria both in price action and volume.
Stages of the Price Action
Downtrend to form Left Shoulder
The rally from Left Shoulder does not breach the Neckline
Downtrend from peak of rally to form Head
The rally from the Head also does not breach the Neckline
Downtrend from Peak of rally to form Right Shoulder
The rally from the Right Shoulder breaches the Neckline
A Return move from the breakout back to Neckline -> This stage we are currently playing out
Volume Signs of Textbook Inverse Head & Shoulder
1. Left Shoulder has taller volume bar (higher volume) than Head Volume
2. Lighter volume or shorter bars seen for Head than Left Shoulder
3. The rally from Head to Right Shoulder has increasing volume that exceeds volume of the rally from left shoulder to neckline
4. DOwntrend to Right Shoulder -> shows a declining volume bar height / declining volume
5. Sharp Spike on Volume during rally from Right Shoulder to Neckline breakout
6. Declining Volume during current move, the Return Move
Thoughts:
Both times we rallied from the shoulders we reached a Resistance zone and got rejected.
I believe we are currently in the "Return Move" to test the Neckline as Support
-> The areas i am looking is:
1. 0.5 FIB Level, this is also where the 21 EMA converges so a Support zone to watch
This area is important because it is the "Golden Zone" for FIB, as well as where the 21 EMA is at. This makes this area a place to observe for potential bounce. Though i believe this to be short lived.
2. Testing Support on the NECKLINE SUPPORT line
3. This one is least likely but nevertheless still possible, the 0.382 FIB Level, a potential scenario being a WICK down from testing support on Neckline
After testing these levels i believe that Coinbase will start its Bull run where it has tremendous growth in market cap
A first target would be breaching the Resistance zone and confirming it as Support.
Take a look for yourself. Experts let me know what yall think!
Stay tuned for more updates on COIN in the near future.
Thank you for taking the time to read my analysis. Hope it helped keep you informed. Please do support my ideas by boosting, following me and commenting. Thanks again.
If you have any questions, do reach out. Thank you again.
DISCLAIMER: This is not financial advice, i am not a financial advisor. The thoughts expressed in the posts are my opinion and for educational purposes. Do not use my ideas for the basis of your trading strategy, make sure to work out your own strategy and when trading always spend majority of your time on risk management strategy.

COIN - Further Lows On The PlateThe last chart i COIN I showed you (see linked) was a nice play. Will this one cooperate too?
Let's analyze the chart:
The white Fork's CL was reached.
It came down hard and fell beyond the L-MLH.
We see the orange Fork, a pullback Fork.
Price struggled to jump above it's CL a view days ago, and now opened and closed below it, AND below the white Forks L-MLH.
Because I want to give this trade a little room, I initiated an Options Strategy by combining Short & Long Spreads.
You can see in the Black Window (Graph), there is plenty of room to let it go against the initial idea.
The B/E point is at the $85 short Call.
When time passes and price would stay exactly where it is now, the position would create a little profit.
If price is going up and stays between the horizontal line (yellow Arrow in the Graph), we profit.
If price of COIN starts to fall, we make profits along the dotted white line.
So, what's the benefit of this trade?
Why not play it directional by just shorting COIN?
1. There's a time decay involved.
My short Call-Debit-Spread generates money, every day by decaying in value.
2. There's the directional aspect.
If price cooperates, then the position profits from the "right" movement AND 1.
Downside?
If price MOVES (it HAS to move) in the wrong direction above $85, then I loose with both positions.
Luckily I can manage this options strategy when ever I want. I can open and/or close Spreads, I can add or remove Legs in favor of my position. I can add Stocks Long OR Short.
Too complicated?
I learned, that success does not just come from a 1-Trick trading Setup/System. If you want to survive in to-days markets, you have to learn, adapt and never stop this process.
I personally like to have as many possibilities to skin my Cats as possible.
I'm a Nerd, a Tr8dingN3rd and I live for what I do §8-)

Coinbase ($COIN): Opportunity or failure?In mid-long term we are not so much bearish about NASDAQ:COIN and we think that the bulk of the descent has already been done. Although potentially a bearish structure (wave 5) could still be missing, by the end of 2023 we expect a rally around 110 area . At this moment we are obviously not talking about trading but about some interesting investment opportunities.
Of course we can't help thinking about what happened last week, but at the same time we think that sooner or later the Company will be able to meet all the clarification requests from the SEC.
Trade with care!
Like 🚀 if my analysis is useful.
Cheers!

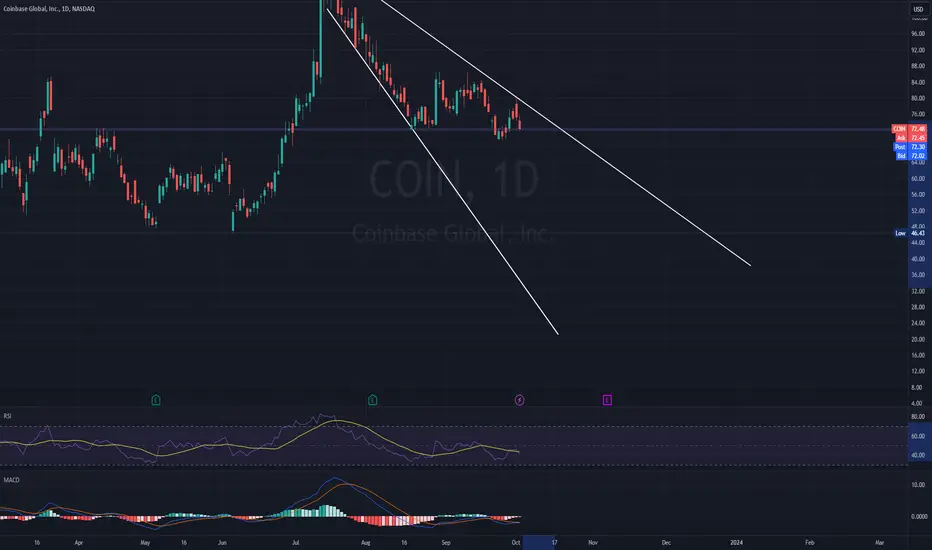
COIN - Targets In AdvanceThese days I dont give too many targets in advance but this one I will and potentially this is a very lucrative call.
The current limp ascending wave looks like it will connect another wave down to hit the 50 week MA that we have been eyeing up for some time and be a great buy between $60 - $65 within the 1:0.618 Golden Window.
It could extend down to the 1:1 but that it a stronger wave extension and if COIN is bullish in higher time frame then more likely it will be the weaker 1:0.618 GW that finds the low.
We'll see how it progresses and my clients will get regular updates.
This is not a short
Not advice.

COIN LONG Potential As you can see it seems to find a support on the trend line which can lead to get the price up, at least to the resistance level above.

$COIN - $31.70 Price Target with MAJOR Bear Flag Setup A major bear flag has setup nicely with NASDAQ:COIN stock. The price target is at a previous support area of around $31.70. Short at the break of flag for a potential win at that level. Remember the price target's measured move is the length of the pole of the flag pattern.

Short CoinWeekly doji candle and bear flag
Shorts or puts
TP: To be seen, till reversal weekly candle

Coinbase to breakdown?Coinbase - 30d expiry - We look to Sell a break of 71.88 (stop at 77.88)
The primary trend remains bullish.
This stock has seen poor sales growth.
There is no clear indication that the downward move is coming to an end. 72.10 has been pivotal.
A break of the recent low at 72.10 should result in a further move lower.
Our profit targets will be 56.88 and 54.88
Resistance: 86.36 / 88.00 / 90.00
Support: 75.46 / 72.10 / 70.00
Please be advised that the in formation presented on TradingView is provided to Vantage (‘Vantage Global Limited’, ‘we’) by a third-party provider (‘Everest Fortune Group’). Please be reminded that you are solely responsible for the trading decisions on your account. There is a very high degree of risk involved in trading. Any information and/or content is intended entirely for research, educational and informational purposes only and does not constitute investment or consultation advice or investment strategy. The information is not tailored to the investment needs of any specific person and therefore does not involve a consideration of any of the investment objectives, financial situation or needs of any viewer that may receive it. Kindly also note that past performance is not a reliable indicator of future results. Actual results may differ materially from those anticipated in forward-looking or past performance statements. We assume no liability as to the accuracy or completeness of any of the information and/or content provided herein and the Company cannot be held responsible for any omission, mistake nor for any loss or damage including without limitation to any loss of profit which may arise from reliance on any information supplied by Everest Fortune Group

Coinbase Breakout Done, Waiting RetesT!Hi friends, Sharing coinbase 4H chart as we can see it gives furious move of almost 15% after breakout this breakout it gives after a identical bounce back form it's support which earlier was a resistance, and now showing some traction towards a horizontal support below which also was a resistance for it also a parallel channel support placed very well there, in this channel it did consolidation after support bounce and formed a base before breakout. So i am planning to go long if it will come and test its retest zone and bounce from there.
This is not and trade or investment advice. This idea is meant for learning only.
Best Regards happy trading- Amit


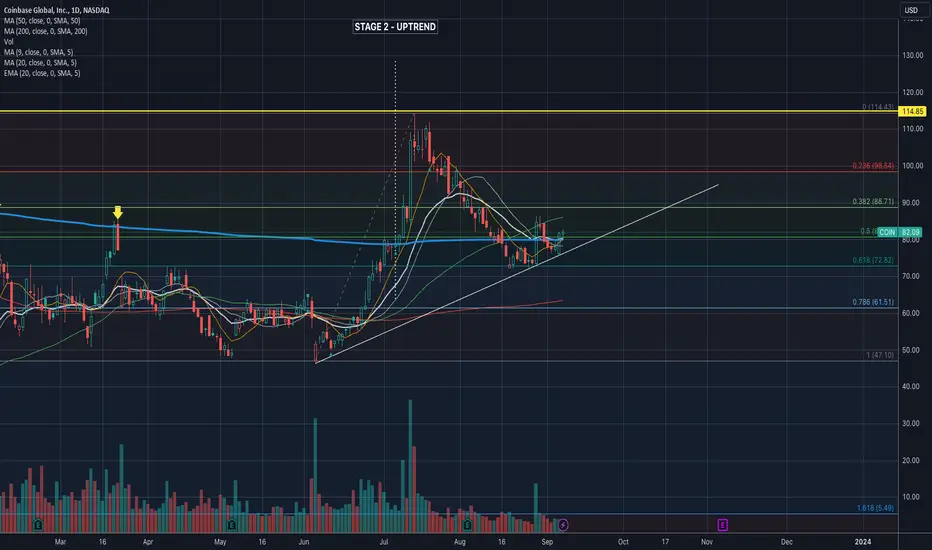
$COIN found support at the 0.618 Fibonacci retracement levelNASDAQ:COIN found support at the 0.618 Fibonacci retracement level. It is currently above the VWAP but below the 50-day moving average. The 9-day moving average crossed above the 20-day moving average, which is a good sign. Oscillators are also turning up.
However, the stock price needs to cross above $90 to continue the bullish trend.
Breaking below $72 would be bearish and could see it go down to the $61-$62 area.
The price movement of Bitcoin and the SEC's decision on a Bitcoin ETF will dictate the direction.
$COIN (Coinbase share)My biggest bet in 2024 is this.
ETF is a huge driver for industry, Coinbase capt institutions and retail.

Coin attempting to retake 20SMA and long resistanceCoin testing 20 day SMA after a clear downtrend reversal. Looking to collide with 20 day and a longer-term resistance at same inflection point.

COINBASE Needs one more dip before it turns a buy again.Coinbase Global (COIN) is neutral within the 1D MA50 (blue trend-line) and 1D MA100 (green trend-line) after the July 14 - August 18 fall. Even though the 1D MACD has formed a Bullish Cross, we don't think this is a buy opportunity yet, at least not until the 1D MA200 (orange trend-line) gets tested. We have seen this Channel Down-into-consolidation pattern before and always ended with a new Low. The Higher Lows trend-line is there to offer Support long-term (has been doing so since the start of 2023). Our target after that dip will be the 1W MA100 (red trend-line), which is the long-term Resistance. We expect a potential contact around 98.50.
-------------------------------------------------------------------------------
** Please LIKE 👍, FOLLOW ✅, SHARE 🙌 and COMMENT ✍ if you enjoy this idea! Also share your ideas and charts in the comments section below! **
-------------------------------------------------------------------------------
💸💸💸💸💸💸
👇 👇 👇 👇 👇 👇

$COIN - Consolidation Zon Trading with PT of $46.50It is very clear that the stock price is trading back into its consolidation zone. Watch for continue trend heading lower to a price target of $46.50 where there is lots of supply.

COIN has been closing negative for five consecutive weeksCOIN has been closing negative for five consecutive weeks
This chart shows the weekly candle chart of Coinbase stocks over the past two years. The top to bottom golden section at the end of 2021 is superimposed in the figure. As shown in the figure, the low points of Coinbase stock in 2022 and 2023 are exactly 2.382 positions of the top to bottom golden section in the figure! Recently, the high click rate of Coinbase stock has broken through the 2.000 level of the top to bottom golden section in the chart, and has fallen back. It has been closing negative for five consecutive weeks, and last week's weekly closing line showed a small positive line with an upper shadow line. This week, we will continue to explore the upper limit, but it is obvious that the bulls are weak! In the future, use the 2.000 bits of the top to bottom golden section in the graph as the watershed to determine the strength of Coinbase!

$COIN - Can this get over the $96.00 level?Coinbase has four rejects at this $96 level. Crypto needs some good news for this to run higher and above that level.

COIN NASDAQ A bearish flag can be seen that shows a continuation of the bearish trend again after this correction phase we can use the ABCD tool for projection.

Coinbase UPdateBullish Divergence on the weekly time frame (annual time frame) indicating a run for the next 4 months.
Oversold stochastic
Market exhaustion on the RSI, also showing bullish divergence.


📊Coinbase Teams Up With Paypal In Europe (Easy 100% Potential) I think it is great news for the Cryptocurrency market, this partnership.
Coinbase and Paypal will be working together in Europe to allow users from Germany and the UK to withdraw/deposit using Paypal. They plan to expand this feature to other European countries.
This is great, Cryptocurrency adoption continues to move forward.
The COIN stock is set to produce amazing growth, based on the technical details of this chart.
The potential goes to 100%, 200% and 300%, with much more long-term.
Coinbase Global, Inc. is very like to grow, grow, grow and grow, non-stop for a long-time, as Cryptocurrency becomes mainstream and welcomed all around the world.
Thank you for reading.
Happy Blue Full Moon!
Namaste.
