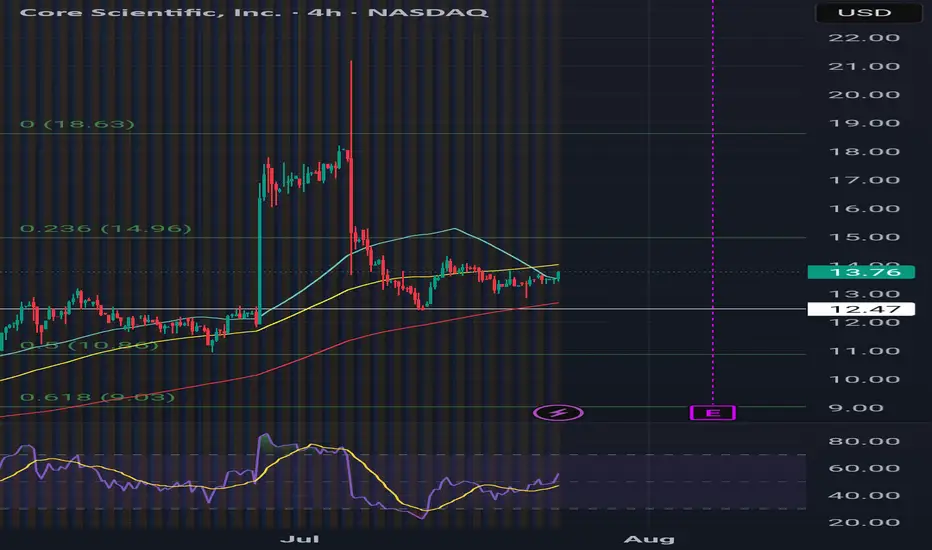
$CORZ LoadedTime Frame: 1D
RSI : Bullish
MACD: Bearish, looking for momentum
Fib Levels: Retraced back to 50.0%
Target: $16.28
Pattern invalidated of drop below 61.8% ($10.94) Fib level.
Next report date
—
Report period
—
EPS estimate
—
Revenue estimate
—
−4.85 USD
−1.12 B USD
510.67 M USD
278.29 M
About Core Scientific, Inc.
Sector
Industry
CEO
Adam Sullivan
Website
Headquarters
Dover
Founded
2017
FIGI
BBG01L5GH011
Core Scientific, Inc. engages in the business of operating a purpose-built facility for digital asset mining and provision of blockchain infrastructure, software solutions, and services. It operates under the Mining and Hosting segments. The Mining segment focuses on bitcoin mining for the company's own account. The Hosting segment includes blockchain infrastructure and third-party hosting business. The company was founded by Michael Jeffrey Levitt and Darin Feinstein on December 13, 2017 and is headquartered in Dover, DE.
Related stocks

Bullish flow I grabbed the 15c Jan today chart setup looks good I know there's an active lawsuit going on DYOR but the flow calls have been active. Add to your watchlist atleast incase we get a dump.
7/2/25 - $corz - Have we forgotten...?7/2/25 :: VROCKSTAR :: NASDAQ:CORZ
Have we forgotten...?
- there's a possible deal happening here
- btc is ripping and so your downside beta is probably somewhat stagnant from the deal bid
- and then you just have natural rip on all energy/ hpc-btc complex stuff beta ripping
- nevermind the actua

Core Scientific: Getting ready for a move higherCore Scientific is forming a bull flag in the $9-$10 range. These bitcoin miners tend to follow bitcoins price movements on a grand scale, while bitcoin has dropped 20% since June 6th from a high of $71,000, down to Fridays close of $56,600, miners like Core Scientific have stayed steady. It cannot

CORZ : Long Position with 2.5 Risk Reward RatioOur stock is trading on 50 and 200 period moving averages. (Timeframe : 1H)
Our first target level could be the level where the gap closes.
Stop - Loss can be placed around the 200 period moving average. Summary in light of this brief information:
Risk/Reward Ratio : 2.51
Stop-Loss : 15.95

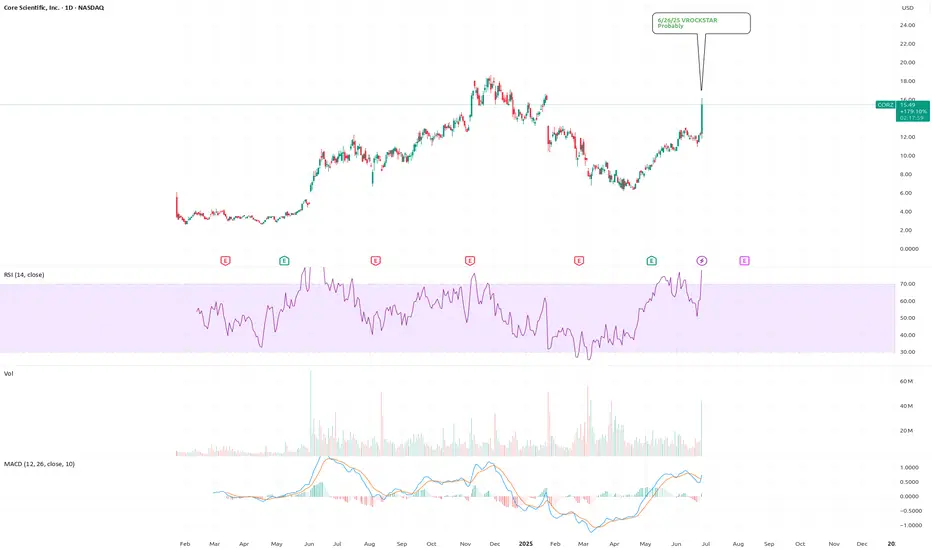
6/26/25 - $corz - Probably6/26/25 :: VROCKSTAR :: NASDAQ:CORZ
Probably
- NASDAQ:CRWV take private?
- we know a few things
- they haven't upgraded their btc fleet in over a year, which says "we're really not in that biz anymore and really only HPC"
- we know there's a mispriced stake in NASDAQ:CRWV embedded
- we know
Core Scientific (CORZ) – Mining Bitcoin to Powering AICompany Snapshot:
Core Scientific NASDAQ:CORZ is evolving from a crypto miner into a high-density colocation provider, strategically pivoting into the explosive AI infrastructure space.
Key Catalysts:
Strategic Shift to AI Infrastructure 🧠📡
$1.2B agreement with CoreWeave expands AI compute colo

CORZ / 4hNASDAQ:CORZ may have ended the rising tide by 80% as wave a (circled) at 11.33. And it's very close to the estimated target >> 11.71.
Turning to an expected correction downward in the same degree wave b(circled) is anticipated.
#CryptoStocks #CORZ #BTCMining #Bitcoin #BTC

CORZ / 4hNASDAQ:CORZ might continue to advance by 8%, and it would be prior to the correction in wave b(circled) downward. The estimated target >> 11.71
#CryptoStocks #CORZ #BTCMining #Bitcoin #BTC
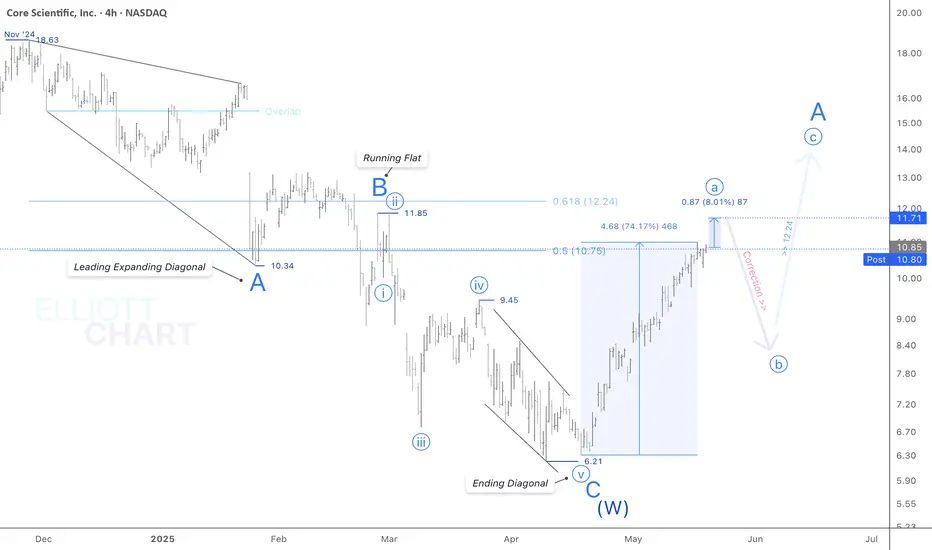
CORZ / 4hNASDAQ:CORZ has continued to advance to 70% total, very close to the first Fib-target >> 10.75, so it would be considered as wave a(circled) of the ongoing Minor degree sequence of A.
Now >> Turning to correcting down in the same degree wave b(circled) of A is expected.
#CryptoStocks #CORZ #BT

See all ideas
Summarizing what the indicators are suggesting.
Neutral
SellBuy
Strong sellStrong buy
Strong sellSellNeutralBuyStrong buy
Neutral
SellBuy
Strong sellStrong buy
Strong sellSellNeutralBuyStrong buy
Neutral
SellBuy
Strong sellStrong buy
Strong sellSellNeutralBuyStrong buy
An aggregate view of professional's ratings.
Neutral
SellBuy
Strong sellStrong buy
Strong sellSellNeutralBuyStrong buy
Neutral
SellBuy
Strong sellStrong buy
Strong sellSellNeutralBuyStrong buy
Neutral
SellBuy
Strong sellStrong buy
Strong sellSellNeutralBuyStrong buy
Displays a symbol's price movements over previous years to identify recurring trends.
US21874AAE6
CORE SCIENT. 24/31 ZO CVYield to maturity
−0.20%
Maturity date
Jun 15, 2031
US21874AAC0
CORE SCIENT. 24/29 CVYield to maturity
−5.79%
Maturity date
Sep 1, 2029
See all CORZ bonds
Frequently Asked Questions
The current price of CORZ is 13.19 USD — it has decreased by −0.11% in the past 24 hours. Watch Core Scientific, Inc. stock price performance more closely on the chart.
Depending on the exchange, the stock ticker may vary. For instance, on NASDAQ exchange Core Scientific, Inc. stocks are traded under the ticker CORZ.
CORZ stock has risen by 2.80% compared to the previous week, the month change is a −19.67% fall, over the last year Core Scientific, Inc. has showed a 25.38% increase.
We've gathered analysts' opinions on Core Scientific, Inc. future price: according to them, CORZ price has a max estimate of 23.00 USD and a min estimate of 14.00 USD. Watch CORZ chart and read a more detailed Core Scientific, Inc. stock forecast: see what analysts think of Core Scientific, Inc. and suggest that you do with its stocks.
CORZ reached its all-time high on Nov 26, 2024 with the price of 18.63 USD, and its all-time low was 2.61 USD and was reached on Feb 1, 2024. View more price dynamics on CORZ chart.
See other stocks reaching their highest and lowest prices.
See other stocks reaching their highest and lowest prices.
CORZ stock is 6.83% volatile and has beta coefficient of 2.87. Track Core Scientific, Inc. stock price on the chart and check out the list of the most volatile stocks — is Core Scientific, Inc. there?
Today Core Scientific, Inc. has the market capitalization of 4.17 B, it has increased by 5.61% over the last week.
Yes, you can track Core Scientific, Inc. financials in yearly and quarterly reports right on TradingView.
Core Scientific, Inc. is going to release the next earnings report on Aug 7, 2025. Keep track of upcoming events with our Earnings Calendar.
CORZ earnings for the last quarter are 1.25 USD per share, whereas the estimation was −0.12 USD resulting in a 1.17 K% surprise. The estimated earnings for the next quarter are −0.07 USD per share. See more details about Core Scientific, Inc. earnings.
Core Scientific, Inc. revenue for the last quarter amounts to 79.53 M USD, despite the estimated figure of 86.20 M USD. In the next quarter, revenue is expected to reach 83.83 M USD.
CORZ net income for the last quarter is 453.32 M USD, while the quarter before that showed −184.79 M USD of net income which accounts for 345.32% change. Track more Core Scientific, Inc. financial stats to get the full picture.
No, CORZ doesn't pay any dividends to its shareholders. But don't worry, we've prepared a list of high-dividend stocks for you.
As of Jul 29, 2025, the company has 325 employees. See our rating of the largest employees — is Core Scientific, Inc. on this list?
EBITDA measures a company's operating performance, its growth signifies an improvement in the efficiency of a company. Core Scientific, Inc. EBITDA is 8.96 M USD, and current EBITDA margin is 21.33%. See more stats in Core Scientific, Inc. financial statements.
Like other stocks, CORZ shares are traded on stock exchanges, e.g. Nasdaq, Nyse, Euronext, and the easiest way to buy them is through an online stock broker. To do this, you need to open an account and follow a broker's procedures, then start trading. You can trade Core Scientific, Inc. stock right from TradingView charts — choose your broker and connect to your account.
Investing in stocks requires a comprehensive research: you should carefully study all the available data, e.g. company's financials, related news, and its technical analysis. So Core Scientific, Inc. technincal analysis shows the sell today, and its 1 week rating is buy. Since market conditions are prone to changes, it's worth looking a bit further into the future — according to the 1 month rating Core Scientific, Inc. stock shows the buy signal. See more of Core Scientific, Inc. technicals for a more comprehensive analysis.
If you're still not sure, try looking for inspiration in our curated watchlists.
If you're still not sure, try looking for inspiration in our curated watchlists.