CRONOS Group $CRON is breaking outIt is forming ugly double bottom that needs to hold above $6.65. The volume is well above the average, rsi is breaking out too.
If you find my charts useful, please leave me "like" and "comment"
thx
CRON trade ideas


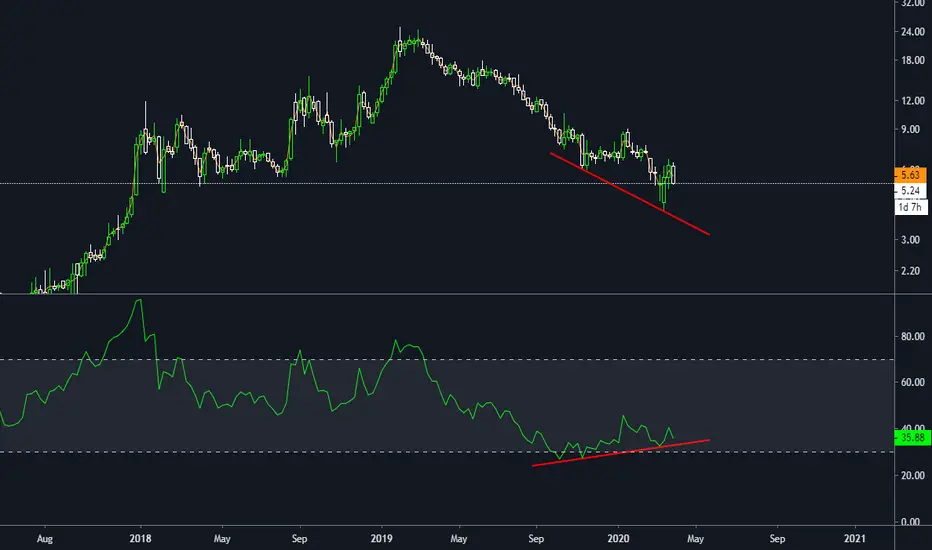
Long CRONFrom Oct. 19' to March 20', the Crono's price stock has been making new lows, and the OBV indicator has been following the same trajectory. On the other hand, The RSI indicator was making new highs (red uptrend line).
This divergence showed that seller's exhaustion was approaching. In fact, an inverse head and shoulders was formed. Not only this, but volume just broke downtrend line.
In the last two weeks, this stock has increased 59%.
In conclusion, price may have more room to keep increasing.

$CRON $7.25 short term target
In the after hours session the Fibonacci .5 level is holding as resistance.
Alert is set for break above this level for a target at $7.25 which is heavy resistance level.
If that manages to break $9.00 is very reasonable as next target

all the roads lead to CronLooks like CRON is next for a run up.
MACD on daily and hourly is pointing up.
Very tight range.
It may fake out downwords movment, but I am very optimistic on up direction.
My first target is 6.85; lots indicators pointing towards it.
Two other targets are resistances. I'll take one step at the time.
I am going for a swing as of this morning.
Good luck and stay healthy !


Cron heading into earningsCronos Group is cash-heavy and asset-light going into earnings. Indicators are positive and recovery has been healthy/slow and steady (IMHO).

CRON Alert set at 6.65If CRON make another run at 6.65 I'll try it long up into dotted targets.
with a tight trailing stop if I get the move. Notorious pop and drop name but if it gets going again this sector can rip.

$CRON Cronos $6.80 Short term Target
Broken out from channel and remained above local POC.
Next resistance is the POC at $6.86 with $6.62 as horizontal resistance and 100 day moving average


$CRON Weekly Close Range between weekly horizontal support
and descending channel getting very tight
$6.90 level of interest before considering a long

Ascending Triangle or Head & Shoulders?On the RSI there's a H&S patter so visible if I need to draw it I'm not sure you're familiar with a Head & Shoulders pattern.
What Is A Head And Shoulders Pattern?
A head and shoulders pattern is a chart formation that resembles a baseline with three peaks, the outside two are close in height and the middle is highest. In technical analysis, a head and shoulders pattern describes a specific chart formation that predicts a bullish-to-bearish trend reversal. The head and shoulders pattern is believed to be one of the most reliable trend reversal patterns. It is one of several top patterns that signal, with varying degrees of accuracy, that an upward trend is nearing its end.
Key Takeaways
A head and shoulders pattern is a chart formation that resembles a baseline with three peaks, the outside two are close in height and the middle is highest.
A head and shoulders pattern describes a specific chart formation that predicts a bullish-to-bearish trend reversal.
The head and shoulders pattern is believed to be one of the most reliable trend reversal patterns.
What Does The Death Cross Tell You?
The death cross occurs when a short-term moving average (typically 50-day SMA ) crosses over a major long-term moving average (typically 200-day SMA ) to the downside and is interpreted by analysts and traders as signaling a definitive bear turn in a market.
The opposite of the death cross occurs with the appearance of the golden cross, when the short-term moving average of a stock or index moves above the long-term moving average. Many investors view this pattern as a bullish indicator. The golden cross pattern typically shows up after a prolonged downtrend has run out of momentum. As is true with the death cross, investors should confirm the trend reversal after several days or weeks of price movement in the new direction. Much of the process of investing by following patterns is self-fulfilling behavior, as trading volumes increase with the attention of more investors who are driven in part by an increase in financial news stories abut a particular stock or the movement of an index.
Limitations Of Using The Death Cross
All indicators are “lagging,” and no indicator can truly predict the future. Once & while a death cross can produce a false signal, and a trader placing a short at that time would be in some near-term trouble. Despite its apparent predictive power in forecasting prior large bear markets, death crosses also do regularly produce false signals. Therefore, a death cross should always be confirmed with other signals and indicators before putting on a trade.

Cronos at its long term trendlineCronos is at a crucial long term support area. I believe the MJ space will begin consolidating and get its act together in the coming years, and those with large amount of cash will be well positioned to survive/capitalize. It’s very possible if the market at large suffers the pain it seems to inevitably still endure, this could go lower.
AC
This is not investment advice of any kind, always consult a professional.

Cronos Critical level pre earnings $cronEarnings after the bell, much anticipated given the well documented accounting issues.
Major influence on the entire market tomorrow.
$6.99 point of control is key in confluence with Fibonacci Golden pocket

Cronos Group continues descending channelCronos group is currently trading within a steep downwards parallel channel. My expectation is that this channel will break within a few months, steep channels like this rarely last this long on non logarithmic charts. I would love to buy an accumulation towards the bottom.

Cronos Group bulls have got a big battle ahead. $cron
Huge convergence of resistance above
Add to that accountability issues.
Pleas visit our discord for more in depth analysis, link on status bar.

$CRON Close Encounters of the Six KindNASDAQ:CRON
Don't mind picking this up around $6. Been trading sideways since the beginning of November, but has traded around $6 six times since February of 2018. 6 for 6 at $6. Too many sixes if you know what I mean. So does it go for a 7th time? I'll sell naked puts at $6 until then.

Cronos Group $CRONDouble bottom and positive divergence for $CRON. Watch for break $9 out for coming weeks

$CRON Cronos getting some loveNo smoke without fire, something stirring here today be careful is it a bull trap or short squeeze ?

Super reversal in Cronos $cron
Nice moving average cross bullish
22% reversal of pre market lows. bulls taking charge
$6.50 target if strength continues

4HR INV H&S Potential Scouting Potential Inverse H&S. If play doesn't come to me I will not enter any positions.
