CSCOBroken key level of $28 could re-test $29.50 in the short term. After last session high volume move looks as though further buying potential. Site above all key moving averages.
CSCO trade ideas

CSCO: Ruled by doubt and some weaknessThis formation occurring at the top signals weakness. The broadening top failed, and a descending triangle-like formation seems to be in the making. Despite the apparent weakness of the stock, the weekly support (green dashed line) has proven to be still in effect. No definitive signal is in play at the moment.


Dogs of the DOW - One Year Entrance - CSCOThe current Dogs are: CVX, CAT, VZ, PFE, CSCO, IBM, BA, MRK, INTC, XOM. CVX is waiting. CAT IS A BUY. VZ is a buy. PFE is one to wait for. CSCO, you buy. Take a look at each one of those names on a DAILY CHART. Set only ONE Exponential moving average on the chart. Just one. Nothing else. A 33 Exponential Moving Average, offset by 3. As soon as you get a Daily Close of any of those stocks, above that 33 Exponential moving average, buy the stock, and hold it for the year, up to February 24th, 2017. That's it, that's the entire strategy


Pullback in Long Term Trend Descending channel makes confluence with long term trend line (red) and price. Double bottom at confluence as pullback after break of previous swing high. Short term target at last swing high. Ultimately price could breakout of channel offering a secondary entry at the pullback after the channel breakout with long term target around $34. If price instead breaks down through the long term trend line, then almost surely will setup a strong short on a rally back up to trend line, for now continue trading with the trend.

CSCO the other point of view LONG?If the price is up and close the down gap @ $26.8, may consider to open Call with near term target @ $27.65, and next @ $29. Stop loss @ $26.5

CSCO GAP DOWN - SHORT?Dec 11 opened gap down after bearish candles of 3 days before, open Short once the open price lower than the close @ $26.2, stop loss if price hike up to close the down gap $26.6 (or $26.5)

CSCO self repeating Nov 2010CSCO will report earnings on the 11/12. The picture is pretty similar to what happened on November 2010. It's hard to find fractals like this: it reminds lumber 2012/2014.

DOW JONES OVERVIEW: CISCO IN MACRO RANGECisco Systems trades in macro range - on 5 and 10 year basis.
Price is now currently trading between 2 key levels. The lower level is combined from 5-year (260 weeks) and 10-year (520 weeks) means and is at about 22. The higher level is combined from upper 1st standard deviations from the same means and is at 27.
Price trading within 1 standard deviation is not trending, thus the range outlined above is lateral
On short term basis the held the lower 1st standard deviation from 1-year mean (264 days), thus failed to enter a downtrend on 1-year basis. However it succeeded in falling below the 1st standard deviation from quarterly mean (66 days), thus it is on a downtrend risk there at the moment.
Overall situation hints that the price is likely to remain in the long term range for observable future (22-27)


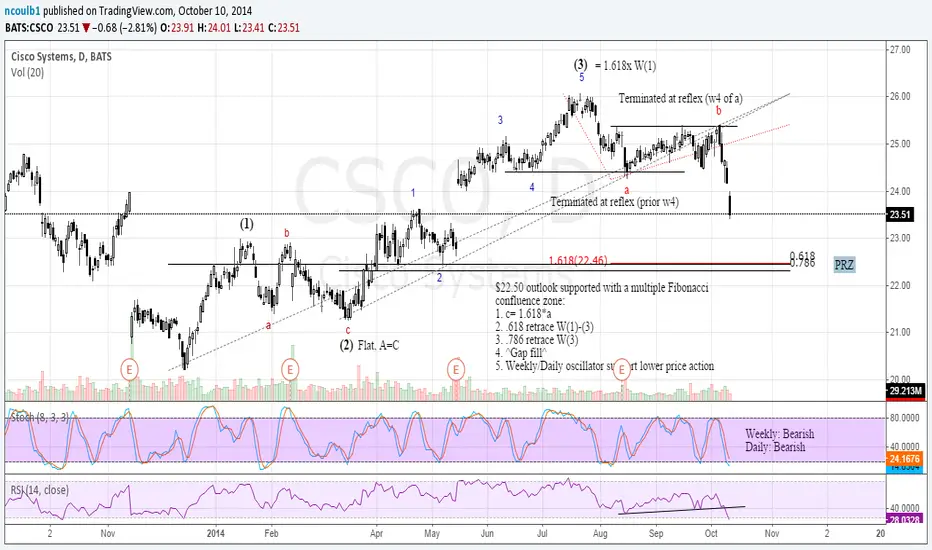
CSCONotes on chart. Hard to play right here until either above the Bat tgt or back to the .886. Notes on chart

Short Term Correction to the Upside in CISCOA short term move to the upside is possible in cisco. Since this is a B wave correction, I expect the upmove to be choppy. Trading this is only for seasoned traders. For a better opportunity, please check out my chart of BOEING airlines. It offers a much better upmove chance.


CISCO 7-Year Double Bottom Break Out Confirmed, Objective $40Hi Fellow Risk Takers,
Here is an update to the Trend Reversal Breakout idea on CISCO ($CSCO), posted during January (Potential Multi-Year Trend Reversal Spotted for CISCO)
This idea is ideally intended for the long term, up to 1 year or even longer.
(1) During 2008 crisis period, price of Cisco has plunged from around $33 to as low as $13.50 (-56%), which signals an obvious bearish trend.
Price action during this period has taken the form of a bearish down channel, marked by the 2 red trendlines.
(2) Between Dec 2007 to Jan 2014 (7 Years), price has consolidated sideways in a large range ($27.50 – $13.50). We also note the formation of 2 significant price bottoms formed against $13.50.
This means that the market has for 2 times, sharply reject the idea that CISCO stock is worth lesser than 13.50, forming a potential double bottom formation.
(3) From April 2012 up till now, we note a steady upwards trend channel forming, with price currently hovering around $27.50, which is a critical price level at defining the general overall trend.
If price is resisted at $27.50, this means overall trend is still sideways.
However, if price is able to trade and sustain above $27.50, it indicates the end of the sideways trend and the beginning of a bullish trend.
(4) Next we look closely at the recent price action around $27.50 levels.
For the last 2-3 weeks, bears have attempted to trade short due to resistance level around 27.50.
However, following the earnings release, price had gapped to 28.00 and traded higher above the double bottom break out resistance line.
This means traders who were short are now caught in a bear trap and they are now likely to help drive prices higher.
(Projection)
Due to the 7 Year double bottom pattern spotted at (2) and price action has sustained above $27.50 (4), we confirm that price has broken out, establishing a new bullish trend with intention to trade higher.
(Entry Condition)
Anytime from now, as long as price stays above $27.50
(Stop Loss)
Below $26.00, beneath the lowest point of the mini-consolidation at (4)
(Taking Profit)
Traders will have to exercise much discretion and judgement when it comes to taking profit.
The theoretical price measure indicates a reversal objective at $40.00.
Experienced traders will know that there is a difference between theory and actual price behavior in the markets.
It is expected to take significant time to get t0 $40.00 and is more suited for investors with a long term view, around 1 year or even more.
Partial profit can be taken around $33.00, which is resistance levels stretching back to Oct 2007.
(Risk)
There is a risk that bears will try to resist the price sharply, leading to a false breakout.
Given the longer time frame of this idea, there are bound to be a lot of price fluctuations new information which may prevent the price from reaching the theoretical target of $40.00.
Hence locking in partial profit at arounf $33.00 is prudent.
Like it, Share it, Follow it~
Trading View: BreakOutArtist
StockTwits: stocktwits.com/BreakOutArtist
Twitter: twitter.com/BrkOutArtist

Potential Mutli-Year Trend Reversal Spotted for CISCO ($CSCO)Hi Fellow Risk Takers,
Here is a Reversal Breakout idea on CISCO (CSCO).
(1) During 2008 crisis period, price of Cisco has plunged from around $33 to as low as $13.50 (-56%), which signals an obvious bearish trend.
(2) Between March 2009 to August 2011, price has consolidated sideways in a large range ($27.50 – $13.50). We also note the formation of 2 significant price bottoms formed against $13.50.
(3) From April 2012 up till now, we note a steady upwards trend channel forming, with price currently hovering around $27.50, which is a critical price level at defining the general overall trend.
If price is resisted at $27.50, this means overall trend is still sideways.
However, if price is able to trade and sustain above $27.50, it indicates the end of the sideways trend and the beginning of a bullish trend.
(4) Next we look closely at price action around $27.50 levels.
(4a) This is a classic example of price being resisted sharply at $27.50. We can infer that there was a lot of profit taking and short orders being executed at that level, resulting in the sharp resistance.
(4b) Fast forward to the current price action around $27.50. You will notice a different price movement has taken place. Price has being zigzagging back and forth around $27.50 freely without clear direction yet. It is essentially a mini-consolidation across the critical $27.50 levels.
This indicates that there is now a mixture of long and short orders at that level, with no clear winner yet.
The bears are at a greater disadvantage, because with each passing day the shorts are unable to bring the price below $27.50, the case for a reversal breakout becomes more and more compelling.
(Projection)
Due to the double bottom pattern spotted at (2) and the mini-consolidated price action at (4b), we project that price intend to breakout on the upside, to establish a new bullish trend.
(Entry Condition)
Anytime from now, as long as price stays above $27.50.
(Stop Loss)
Below $26.00, beneath the lowest point of the mini-consolidation at (4b)
(Taking Profit)
The theoretical price measure indicates a reversal objective at $40.00
However it will take significant time to get there and is more suited for investors with a long term view.
Shorter term traders can look to take profit at the below 2 levels.
Take Profit Level 1: $30.00
Take Profit Level 2: $33.00
Another plausible profit taking approach will be to
a) close 40% position at $30
b) close another 40% position at $33
c) leave the remaining 20% position for the long term bullish trend to carry price to $40
(Risk)
There is a risk that bears will try to resist the price sharply at $28.50, leading to a false breakout.
Also there is a risk that new information revealed during the Earnings Release, on 11 Feb 2015, may impact the price movement in a negative way.
Like it, Share it, Follow it~
Trading View: BreakOutArtist
StockTwits: stocktwits.com/BreakOutArtist
Twitter: twitter.com/BrkOutArtist
TradeHero: BreakOutArtist
Facebook: www.facebook.com


csco move suits covered callHigh volume move up with short terms EMAs crossing. Higher market volatility suits covered call or OTM out credit spread.

CSCO - Retesting after a Break HigherWatch when if it triggers for large volume. The EMA's are headed bullish and bounced off the 50 EMA. The SMA's are headed steadily higher. Stochastics gave a buy signal recently, RSI is slightly overbought and MACD recently is giving a buy signal. BB need to be broken. ADX is around 35 and would agree with the trade if it headed higher if it confirms.
Trigger is $28.48
Stop is $26.28
Target is $33.81


Not to close the position before receiving the signal from MACD.Similar patterns can indicate a similar result.

It is not the best time to open a short position.But it's also not the best time to close it. The indicator RSI is in a state of extreme oversold. So I would not expect a protracted decline. Those who already holds a short position, I would advise to focus on the area of strong resistance and lower bounds of current trends.