Jackpot. Buy this.Look at that beautiful set up.
MA200 will now act as support. Same thing with the downtrend line.
Buy this on the pullback and hold it
CSIQ trade ideas

CSIQ:US - Bullish above 12.23 towards 14.15 even 14.45. Technicals:
1) Neckline at 12.76 surpassed triggered an inverse H&S
2) However, price closed below fractal level at 12.10.
3) This resistance surpassed will strengthen conviction towards said targets.


TRADE IDEA OF THE WEEK IN CSIQWe like how the Solar Sector is trading separate compared to the rest of the market right now so we entered this trade today. We are hoping for this to be a longer term swing trade for us but it depends on the price action. The momentum looks nice to the upside and I decided to post the weekly chart on this to show the strength in this current move.
Good luck to all!

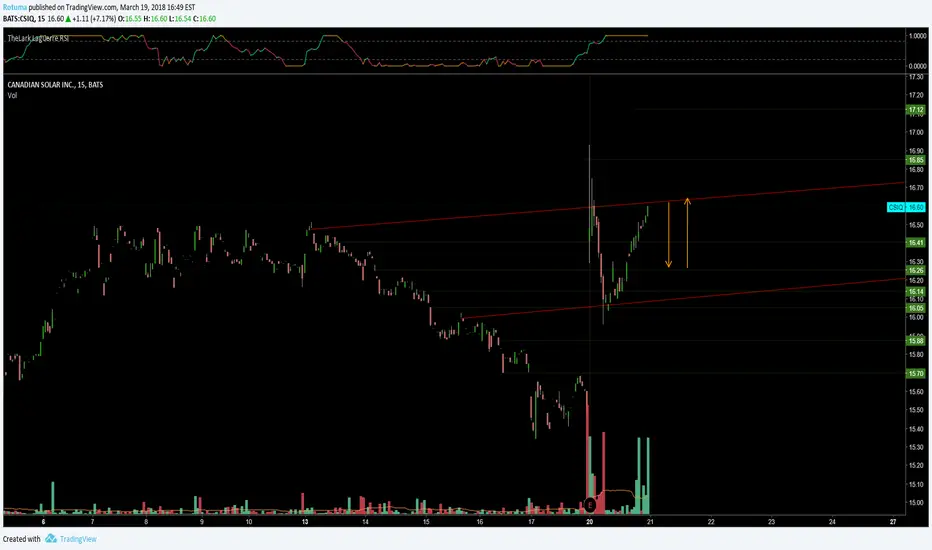
CSIQ - CANADIAN SOLAR INCA good run in today's session after a huge price gap in the opening session. share prices retreated to 16.05 support but headed straight back up with supporting volume finishing the trading session at 16.60. Watching for an opportunity to go long if shares pull back and bounce at 16.41-16.26.
Bearish Rising Wedge Pattern - Targets are given to membersThis bearish rising wedge may indicate lower levels, look for break of lows for confirmation.

Short CSIQ - Expecting Mean Reversion PT : 16.47We are 3 deviations from the mean of our arbitrage band. Math says we can't exist out here without some substantial news coming.
So down we go!


CSIQ LongCSIQ update: uptrend intact with rising volume and approaching some resistance. A break out could happen with a close over the resistance at 18 with volume above avg.

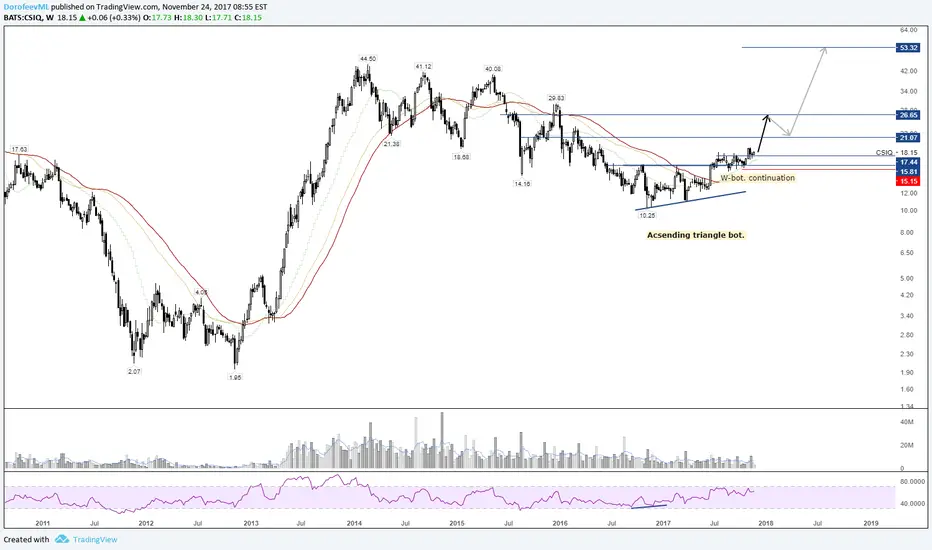
CSIQ - Strong BuyCSIQ made a 52 low and then reversal on Brexit and a "Storm Damage" bad new. It's a perfect buy opportunities and if it re-claim $15.25 area we will see a nice rally. Target 1 $20 - $22 area, target 2 $32 area. Target 3 $40 area

breakout to support level then rebound but don't very big
now: 15.86
buy: 15.92
stop profit: 16.55
stop loss: 15.68

L5A; Canadian solar inc; is a buy!We can clearly see, the short trend should be at its end!
The strong S/R has been broken, and should now be an good support again. So I will wait for the pullback, and then enter my position if price bounces of that support.
Seems to be a good chance, but as always, be carful who you trust and make your own analysis!
Safe trendfollowing to you then!

CSIQ - setting up for Break OutNice consolidation close to resistance. Maybe a Flag/ pennant in the making. Looking for Volume to push through that $16.- resistance level. Target $23ish.

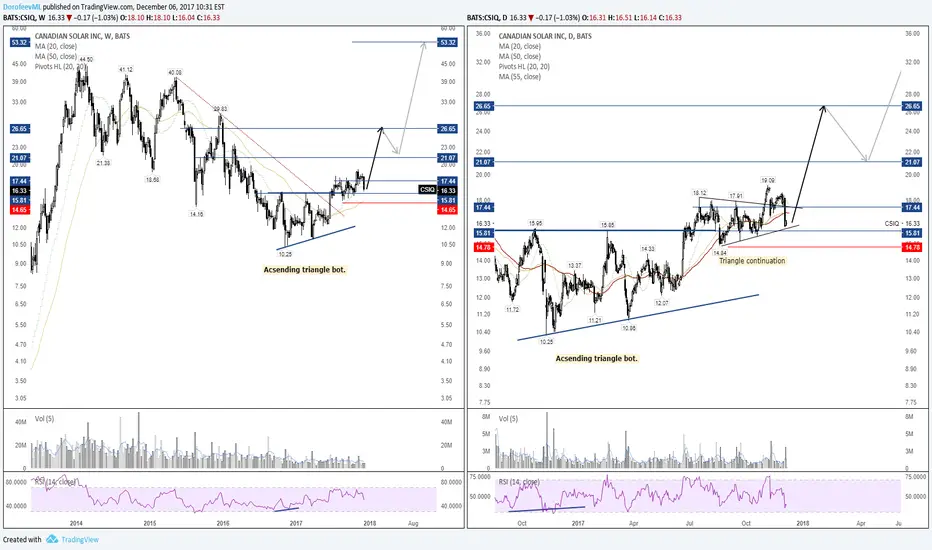
Major accumulation in Canadian Solar?The chart of Canadian Solar is really cool. After the impressive bull run in 2013-2014 the market has been in a corrective pattern that looks like a falling wedge for the last three years.
Since November 2016 the market has Either been consolidating or accumulating between $10 and $15.
I really like the Stock and the whole Sola energy story.
This along with Jinko Solar are on my solar campaign list.


Next week ideas: CSIQStock cleanly broke a long-term downtrend in a rather textbook way. Established some shorter term levels to watch and to trade off of.
For these coming days I'd look for long entries at 13.20-13.50-13.80 with the target into 16.00

Bullish Wedge It appears CSIQ is developing a constructive pattern, falling or bullish wedge formation. Indeed, the bears have been in control of the space, if bulls can push prices higher and out of the wedge CSIQ can shine. Note, the orange arrow the window could provide a good price target. Previous peaks can provide color on price targets and resistance levels too.

$CSIQ- X-Mas pop? Part 1. Just wanted to submit a few charts of stocks I am in and that could have a nice pop just in time for X-Mas.
Of the two, CSIQ is the most volatile. It it still in a downtrend and it is volatile so to take profit and maybe limit your expectations unless you want to be in for the long run.
I put a few red bars on the RSI 50 as it tends to reverse there and also when it touched the Laguerre moving line. It is actually right there, right now. It also had a mini head and shoulder. The last run that worked was for a quick 36%. I did not get the full move (as usual) but a nice slice.
Just make sure to do your own research. I have nothing to sell and I am a part-time trader, not a pro though might equity curve is heading in the right direction.
That being said, if you are a deep-value trader specialized in arcane finance you have to wrong guy to argue. I am not interested in your stuff just like you might not be into my Gilligan's Island drawing. Just type $MSFT on your keyboard and have fun. I am here to make a buck and to show a few possibilities that some traders might have overlooked.
Best of luck if you take the trade.


CSIQ - Long - Swing+ sideway price movement over the past few days over descending volume
+ trend intensity exited out of bearish territory
+ break out bar supported by above average volume
+ NR3 bar prior to break-out
- upper shadow on the break-out bar
+ 5ema piercing through the lower body of today's bar (would be nice if 5ema pierced a bit higher into the mid range of the body)
+ ema cross over upward last week
