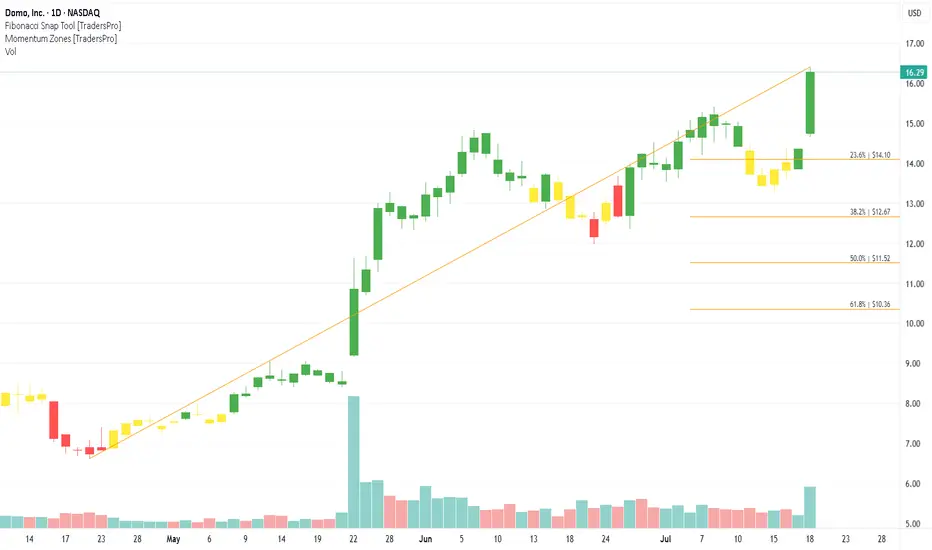
Domo, Inc. (DOMO) Delivers AI-Driven InsightsDomo, Inc. (DOMO) is a cloud-based software company that helps businesses turn their data into actionable insights. Its platform connects data across systems, visualizes it in real time, and enables smarter decisions through AI and automation. Domo’s growth is driven by the ongoing digital transformation of enterprises, rising demand for data analytics, and the need for easy-to-use tools that bring data directly to business users.
On the chart, a confirmation bar with rising volume signals strong buying interest. The price has moved into the momentum zone by breaking above the .236 Fibonacci level. A trailing stop can be placed just below that level using the Fibonacci snap tool to secure gains while staying in the trend.
DOMO trade ideas
DOMO Compression Breakout – Eyes on the 15+ Zone!!""
📊 Trade Setup Summary:
Ticker: DOMO (NASDAQ)
Pattern: Symmetrical triangle (tight price squeeze)
Entry Zone: ~$12.67 (yellow line breakout zone)
Stop Loss: ~$11.68 (white support level)
Target Zones:
TP1: $13.86 (red resistance zone)
TP2: $15.48 (green breakout target)
Risk/Reward Ratio: Approx. 1:2.5+
Volume: Looks healthy, but confirmation on breakout candle is key

DOMO (NASDAQ) - 30-Min Chart Short Trade Setup Breakdown!📉 DOMO (NASDAQ) - 30-Min Chart Short Trade Setup Breakdown 🔻
🔍 Stock: DOMO (NASDAQ)
⏳ Timeframe: 30-Min Chart
📉 Setup Type: Bearish Breakdown
📍 Trade Plan:
✅ Entry Zone: Below $8.82 (Breakdown Confirmation)
🚀 Take Profit 1 (TP1): $8.41 (First Support)
🚀 Take Profit 2 (TP2): $8.01 (Extended Bearish Target)
🔻 Stop-Loss (SL): Above $9.24 (Key Resistance)
📊 Risk-Reward Ratio: Favorable for a bearish continuation 📉
🔹 Technical Analysis & Setup:
✅ Pattern: Rising Trendline Breakdown 📉
✅ Breakdown Confirmation Needed: Price dropping below $8.82 with strong selling volume
✅ Support Zones:
$8.41: First Key Support
$8.01: Extended Target if selling pressure continues
✅ Momentum Shift Expected: Breakdown could trigger further downside pressure 🚀
🔥 Trade Strategy & Refinements:
📊 Volume Confirmation: Look for increasing selling volume below $8.82 📉
📉 Trailing Stop Strategy: Once price reaches TP1 ($8.41), adjust SL lower to secure profits 🛑
💰 Partial Profit Booking: Take partial profits at $8.41 and let the rest ride toward $8.01+ 💵
⚠️ Fake Breakdown Risk: If price rebounds back above $8.82, reconsider entry ❌
🚀 Final Thoughts:
✅ Bearish Breakdown Expected – High probability of continuation lower 📉
✅ Strong Resistance at $9.24 – Ideal short entry for risk-reward optimization 💰
✅ Momentum Shift Possible – A drop below $8.41 could accelerate downside move 🚀
📊 Trade Smart & Stick to the Plan! 🏆🔥
🔗 #ShortTrade #StockTrading #DOMO #TechnicalAnalysis #DayTrading #MomentumTrading #BearishBreakdown #RiskReward #TradingPlan #ProfittoPath 🚀📉
Would you like me to create a TradingView post template for consistent and professional market updates? 🚀

5/23/24 - $domo - short, EPS setup looks -ve across board5/23/24 - vrockstar - NASDAQ:DOMO - setup is ripe for a short (which these days i can only justify w/ P's if it's small cap stuff like this). the reason is... they literally are everything you can't own in this tape
1) broken stock, not a meme
2) years of dwindling growth, zero this yr
3) don't make money, burn; and would be worse if adj. for stock comp - a cash expense for stocks that go down
4) net debt
i've entered some jul19 6P's for 15c which seems like good beta on a rough tape from open. the idea is... if miss/ bad print this goes -10-20% and grinds lower, it's great offset to my longs. if miss/bad print and tape remains risk off... this gets shot to 5 and leaks even lower probably in the coming months. idea is to make 3-4x on this, and even if that's a 50% probability and there's a 50% probability where i go to zero. that's an EV positive trade. i take all of those as you guys who have been reading know.

Up and ComersThis stock gapped-down for no Reason. It beat on BOTH Earnings and Revenue. I bot and have Trailing Stop all the way up... Already in a Profit!!! Let's make Some $'s!

DOMO Potentail Wyckoff AccumulationGreen is the Buy Zone for a potential reversal imo. Waiting for the RSI to be oversold and then let the Weekly and potential Daily Bull divergences play out.
Undervalued and liked by the insiders.

Short Term Pain / Long Term GainsThe current short term outlook for DOMO doesn't appear to be great.
Taking a step back to look at the longer trend makes this chart a lot more bullish .
Two lines of curved resistance have been added to reinforce this idea.
Could plausibly roll into something like a Cup & Handle , but not enough information/confirmation to chart that.
Pivots have been added just because, although I've seen charts where that are more informative.
$10 is a significant price level so I added that.
It also appears to be relatively where the completion of this Bear Flag would be if it goes through on Opening Bell.
The demise of First Republic Bank perhaps would almost assuredly send it to this price range as well.
The overarching fear for the tech/startup space is no room for parking cash.
This could drastically disturb any noted trends here.
Yes, this is a repost, but for some reason the chart was blank until it was clicked on prior.
Tell me if I'm wrong. I don't mind.
Please don't ad hominem though.
DYOR/DYOC.

Short Term Pain / Long Term GainsThe current short term outlook for DOMO doesn't appear to be great.
Taking a step back to look at the longer trend makes this chart a lot more bullish.
Two lines of curved resistance have been added to reinforce this idea.
Could plausibly roll into something like a Cup & Handle, but not enough information/confirmation to chart that.
Pivots have been added just because, although I've seen charts where that are more informative.
$10 is a significant price level so I added that.
It also appears to be relatively where the completion of this Bear Flag would be if it goes through on Opening Bell.
The demise of First Republic Bank perhaps would almost assuredly send it to this price range as well.
The overarching fear for the tech/startup space is no room for parking cash.
This could drastically disturb any noted trends here.
Tell me if I'm wrong. I don't mind.
Please don't ad hominem though.
DYOR/DYOC.

How To: Finding Potentially Oversold Stocks ( 1 + 1 = 3 ??? )With the big market drop on Friday (Dow down 3% and NADAQ almost 4%) I thought I would have a look for some stocks that might have been oversold and their drop exaggerated by the overall market falling.
What will sometimes happen is some bad news plus the overall market having bad news will end up with 1 + 1 = 3 and an overreaction as stop losses get triggered at market causing others to trigger and more to trigger and so on and so on.
TradingView has a bunch of built in tools to make finding these stocks easy to discover and this video is more about showing you different ways to use these tools as opposed to any specific trading recommendations.
Might be a way for you to look at trading differently and seeing if you think there might be any bargains out there that you would like to investigate further. Catch is they are down for a reason, so do your analysis and cover your position in case they have more pain in store :)

DOMO Up or DownLooking bearish after a failed bullish breakout from a bear wedge. No position yet. Two targets for two of the possible outcomes.

$DOMO 2 Months Cup with Handle Setup$DOMO in the computer enterprise software space putting in a 2 months cup with handle.
Double digit sales growth for multiple consecutive quarters but no earnings to speak of yet.
Very strong prior uptrend. worth watching next week

DOMO - Drop before the Rise!-After a great rally to the resistance, Domo decided to take a breather.
-Now, after bleeding quite a bit, Domo is at a very close point to its support which is standing around 78-80.
-We expect it to drop a little bit more to the support before accelerating for another rise.

DOMO - Buy the Dip guys!-Domo remains on track to become free cash flow positive as it begins to win sizable mandates from large corporate customers.
-Accelerating digital transformation is driving demand for a business intelligence integration platform which Domo excels at.
-The current cash burn profile is not positive, but we believe this will improve in the short to medium term. We reiterate our bullish stance.

DOMO - strong RSI (8/16/2021)RSI has not dropped below 50 since breaking on May-20th. Has roared higher and is finally consolidating on lower volume. Has had a run of +55% in a short time period and has held the 23EMA very well which is indicating that stock is in demand. Sellers appear to be getting tired and the stock has moved sideways for 25D.
Could play this as a pullback but when it hits the 23EMA again or breaking past ATH at $92.85. If I play the pullback but I would like the stops near 2.5% below the purchase price. If I play the breakout I would like to set the stop at the 23EMA.


DOMO EarningsUp 80% since last earnings, they aren't growing that fast, something's gotta give. Hitting resistance here anyways.
Couple of put contracts with today's profits from flipping calls. Heck, all it has to do is give up today's gain and you'll break even.

DOMO Signs of PullbackThis stock is pushing up into the 68 & 69 range but keeps being denied. This has caused it to create a Triple Top Pattern that indicates that it has basically hit its near future peak and will see lower prices in the future.

Divergence between VStop and Stan Weinstein’s 30MA* I call Stan Weinstein’s 30MA my most definitive MA line because this is the level where breakouts take place as Stage 1 transients to Stage 2.
* As long as price point remains above the 30MA, the counter will stay in an uptrend and according to Stan Weinstein, we should continue to hold position provided it is is an uptrend. However, if the price point dips below the 30MA, it’s time to exit especially if you’re still holding any position.
* Based on my observations, VStop (Volatility Stop), on the other hand, seems to adhere to the 30MA: lower limits denoted by green+ surface whenever the price point stays above the 30MA while upper limits denoted by yellow+ surface when the price point dips below the 30MA. So it appears that VStop follows Stan Weinstein’s 30MA line.
* Well not so. Through my analysis/observations, divergence between the VStop and the 30MA does appear some times and I find them to be significant for Entry Signals. Taking DOMO as an example, yellow+ began surfacing on 6 Jan which is a divergence from the 30MA. Technically, VStop should be surfacing the green+ as price point is above the 30MA. The VStop green+ only converges on 14 Jan and this is a good Entry Signal to go long. So far, I have verified this finding with other indicators like RSP and MACD amongst others and it appears that my prognosis is correct which is why I’m sharing this with you.
* Word of caution: this is my first sharing as a rookie trader. I always do due diligence whenever someone mentions a noteworthy counter. Just so you know, I’m long on DOMO like yesterday (14 Jan) at $68 which I reckon is a good price point for entry. Although my stop loss is at 30MA, baring any unforeseen situations which may result in earlier exit, I plan to ride this trend as do all trend followers.


DOMO, Aroon Indicator entered an Uptrend on December 17, 2020.Over the last three days, Tickeron's A.I.dvisor has detected that DOMO's AroonUp green line (see chart) is above 70, while the AroonDown red line is below 30. When the green line goes above 70 while the red line stays below 30, this is an indicator that the stock could be poised for a strong Uptrend. For traders, this could mean going long the stock or exploring call options in the next month. Tickeron's A.I.dvisor backtested this indicator and found 143 similar cases, 140 of which were successful. Based on this data, the odds of success are 90%. Current price $69.30 is above $40.98 the highest resistance line found by Tickeron A.I. Throughout the month of 11/16/20 - 12/17/20, the price experienced a +97% Uptrend. During the week of 12/10/20 - 12/17/20, the stock enjoyed a +48% Uptrend growth.
Bullish Trend Analysis
The Momentum Indicator moved above the 0 level on November 23, 2020. You may want to consider a long position or call options on DOMO as a result. Tickeron A.I. detected that in 35 of 48 past instances where the momentum indicator moved above 0, the stock continued to climb. The odds of a continued upward trend are 73%.
The Moving Average Convergence Divergence (MACD) for DOMO just turned positive on November 17, 2020. Looking at past instances where DOMO's MACD turned positive, the stock continued to rise, Tickeron A.I. shows that in 15 of 17 cases over the following month. The odds of a continued upward trend are 88%.
DOMO moved above its 50-day Moving Average on November 25, 2020 date and that indicates a change from a downward trend to an upward trend.
The 10-day Moving Average for DOMO crossed bullishly above the 50-day moving average on December 03, 2020. This indicates that the trend has shifted higher and could be considered a buy signal. Tickeron A.I. detected that in 4 of 5 past instances when the 10-day crossed above the 50-day, the stock continued to move higher over the following month. The odds of a continued upward trend are 80%.
Following a +18.82% 3-day Advance, the price is estimated to grow further. Considering data from situations where DOMO advanced for three days, in 139 of 155 cases, the price rose further within the following month. The odds of a continued upward trend are 90%.

US Stock In Play: $DOMO (Domo Inc)$DOMO is currently playing out a staggered 3-step Stairway to Heaven chart pattern, via a combination from 3 series of successfully Bullish Flag chart pattern breakout in a short span of 15 days trading session. The breakout rally have $DOMO attained +75.78% gain in just two weeks, closing at an all time high of $66.99.
At the current junction, it is critical for $60.91 (the fill of window gap support) to hold during any immediate correction of this rally.

DOMO, Aroon Indicator entered an Uptrend on December 16, 2020.Over the last three days, Tickeron's A.I.dvisor has detected that DOMO's AroonUp green line (see chart) is above 70, while the AroonDown red line is below 30. When the green line goes above 70 while the red line stays below 30, this is an indicator that the stock could be poised for a strong Uptrend. For traders, this could mean going long the stock or exploring call options in the next month. Tickeron's A.I.dvisor backtested this indicator and found 143 similar cases, 140 of which were successful. Based on this data, the odds of success are 90%. Current price $65.25 is above $40.98 the highest resistance line found by Tickeron A.I. Throughout the month of 11/13/20 - 12/16/20, the price experienced a +76% Uptrend. During the week of 12/09/20 - 12/16/20, the stock enjoyed a +39% Uptrend growth.
Bullish Trend Analysis
The Momentum Indicator moved above the 0 level on November 23, 2020. You may want to consider a long position or call options on DOMO as a result. Tickeron A.I. detected that in 33 of 48 past instances where the momentum indicator moved above 0, the stock continued to climb. The odds of a continued upward trend are 69%.
The Moving Average Convergence Divergence (MACD) for DOMO just turned positive on November 17, 2020. Looking at past instances where DOMO's MACD turned positive, the stock continued to rise, Tickeron A.I. shows that in 13 of 17 cases over the following month. The odds of a continued upward trend are 76%.
DOMO moved above its 50-day Moving Average on November 25, 2020 date and that indicates a change from a downward trend to an upward trend.
The 10-day Moving Average for DOMO crossed bullishly above the 50-day moving average on December 03, 2020. This indicates that the trend has shifted higher and could be considered a buy signal. Tickeron A.I. detected that in 4 of 5 past instances when the 10-day crossed above the 50-day, the stock continued to move higher over the following month. The odds of a continued upward trend are 80%.
Following a +24.65% 3-day Advance, the price is estimated to grow further. Considering data from situations where DOMO advanced for three days, in 137 of 153 cases, the price rose further within the following month. The odds of a continued upward trend are 90%.

