DORM long ideaDorman Products - DORM
Consumer Cyclical
Auto Parts
USA
Dorman Products, Inc. supplies replacement parts and fasteners for passenger cars, light trucks, and medium- and heavy-duty trucks in the automotive aftermarket industry worldwide.
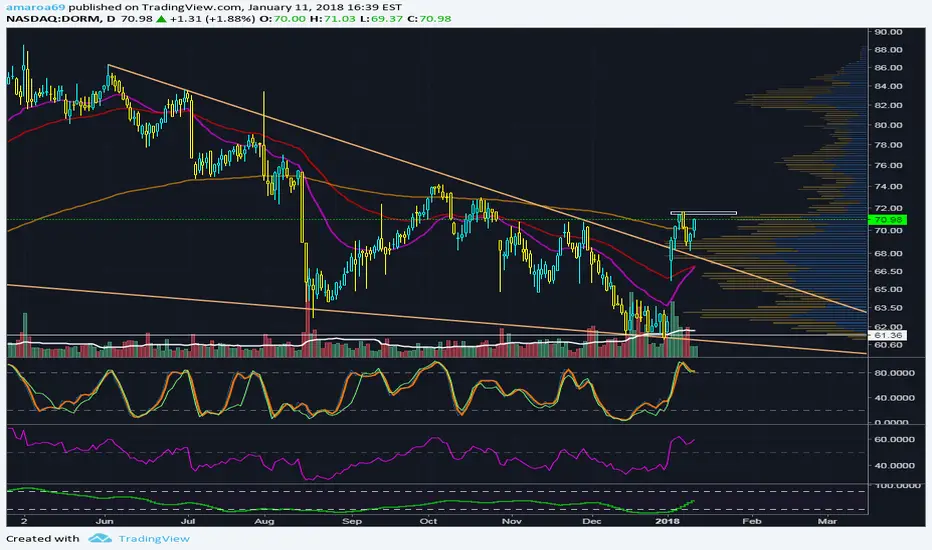
- High volume in stock
- Crossed 200 EMA
- Next earnings date - 25 Jul 2022
DORM trade ideas

Buy and HoldI would like to recommend this stock for those trader that still cannot find stock to trade.

DORM - Short Setup Stop signal 91.64. Looking for break below 85.84. First target 76.53, Second target 67.89


$DORM - Refreshing to see a chart like this, to say the least Typically, I leave the technical explanation for last when I post an idea. Mainly because there's always a different perspective of TA with the bias of someone's bullishness / bearishness on the market, but also because it'd be a waste of space to type out my own TA for each chart since....... it's the same for every chart lmao. THE most accurate charts I've posted, have all been fibonacci based whether I mention "KATTTIEEE" or the "white curve" - instead of wasting space with links to old charts, I'll go over pics of the charts that I saved (months ago) for my own use & future references. So shit doesn't get too clustered - pics & links @ bottom. From all I have saved - $SHOP (Pic 1) is the most accurate comparison - most accurate in the sense that, among the comparisons - the breakout potential + time spent making new highs is much greater than those with only similarities.
The 2nd picture tells a much much (much) bigger story to the strategy that essentially determines the time value (& its validity) of a move after price either invalidates a price target or is just shy of it - this is the "White curve". Rather than use a 50 SMA - try a 55 low SMA. Essentially, it measures the exponential growth after a breakout by the slope of the curve (starting one candle before exp growth begins). i.e calling the top when the lows form a straight line, not when the highs "can't go any higher". ($FDS, $BLKB <- in published ideas). Before I get to the realistic explanation, pic 3 goes out to the imperfections of TA & the reason exponential growth (or depreciation) is foreseeable by actual measurements, but tainted by the noise of reaction to unsustainable returns (like $BTC).
I'm bearish on the dollar, right? So gold, oil, etc., I'd be long.
So the realistic explanation - There's more equities & sectors that have underperformed in the past 3 months than there are that have outperformed in the past 6. & obviously oil & gold is still somewhat of a waiting game (I'm bullish, but, you know). Equity wise - the smartest thing anyone could do is look at the risk-off defensive type stocks. Even then, the outperformance isn't 100% guaranteed. Especially in a QT environment. Since $DORM is a used retailer for auto parts - they're beneficiaries of a middle-class that can afford to spend $300 to fix their check engine light rather than spend $3,000 + a trade in for a new car (Hence the outperformance of even banks during periods of QT). I'm shooting in the dark here but from what I do know, Mexico & Canada are top exporters of auto parts TO the U.S, so I'm not even sure the China tariffs will have much of an impact (if any?). On top of that - you add on the steel & aluminum tariffs to major auto exporters (Germany, Japan, etc.,) that impact the costs of everything related to a vehicle, & finally, price in the rising rates. What's left?
A company that can increase the cost of their own automotive products without the effect of tariffs, aka, the fucking margins guy.
Pic 1 -
Pic 2 -
Pic 3 - (Note: To save space, pic w/ Fib re-traces from 06/05, now updated w/ 55 candle count)

$DORM - The trading system Equity Trend to go long todayToday at the market open (Jan 8), the equity trading system Equity Trend will open a long position in Dorman Productos (ticker: DORM)
Each day, the system scans around 10,000 stocks to find just 1 or 2 which are ready to move immediately.
The system combines elements of breakout trading, trend following and risk management from Turtle trading.
System: bit.ly

DORM Announces Stock Repurchase ProgramDORM: Dorman Products, Inc.
2018-12-13 16:05:00
Dorman Products, Inc. Announces Expansion and Extension of Stock Repurchase Program

Breakout/Re-testBroke out of a falling wedge with good volume, came back and tested it. Would go long if its able to break the previous high(rectangle area). would also manage a tight stop loss because of the low volume we had the past 2 days
DORM Breaking down on Daily. Possible WEEKlY Bearish EngulfingBreaking Below R1 AND the Tenken-sen (9 day MA) with a bearish MACD cross on the daily. OBV Broke the upward trend line, and STOCH turning bearish as well. 1st target is S1 at $41.61. GURU FOCUS also issued a SEVERE warning sign on the stock. www.gurufocus.com

Will this bounce gain momentum?Low volume stock is not a good place to stash your money, but those of you who are bottom fishers may look this stock. This bullish triangle plus 88.6% bounce will encourage to take 1-5 week trade.
