Electronic Arts: Under PressureEA has shown notable upward pressure, diverging from our expected downside continuation. Despite the recent strength, our primary scenario remains valid: we still anticipate an extension of the ongoing magenta five-wave decline, with wave (3) expected to break below support at $114.60. The remaining legs of this impulsive sequence should also stay beneath that threshold, ultimately forming the low of the broader green wave . However, if bullish momentum persists and pushes the stock above resistance at $169.82, we will shift to the alternative scenario (40% probability). This path suggests green wave alt. – and by extension, beige wave alt.IV – has already concluded, and that EA is now in the early stages of wave alt.V, a significant new uptrend.
📈 Over 190 precise analyses, clear entry points, and defined Target Zones - that's what we do.
EA trade ideas
Electronic Arts Inc. (EA) – Inverse Head & Shoulders Breakout📈 Long Setup
🔍 Description:
Electronic Arts Inc. (NASDAQ: EA) has broken out above the neckline of an Inverse Head & Shoulders pattern — a bullish reversal signal. Price action confirms breakout strength, with a surge in volume accompanying the move. Bullish continuation is expected if the breakout sustains, offering a well-defined risk/reward setup.
📊 Trade Details:
🔹 Entry: Above neckline breakout
🔴 Stop Loss: 143.00
🟢 Target: 161.29
📌 Confirmation:
The neckline breakout is supported by strong volume and bullish momentum . Failure to hold above the neckline could invalidate the setup.
Trade safe! 📈✅

Electronic Arts: Heading LowerElectronic Arts has dropped roughly 13% since our last update, continuing the expected decline within ongoing wave (3). This move is likely to break below support at $114.60 and gradually push the stock downward to the anticipated low. Our alternative scenario suggests the correction may already be done, but that path hinges on a convincing move above $169.82 — a threshold we’re not close to yet. For now, the downtrend remains in control.
📈 Over 190 precise analyses, clear entry points, and defined Target Zones - that's what we do.

EA eyes on $150: Not just a round number but also a Genesis fibEA is trying to launch off a Genesis fib at $150.16
This would be a good long entry with right stop Loss.
Minimum target is the red zone above $161.43-161.91

When the game is a quick flip, EA long at 149.27 for the winAs mentioned in the text box, this setup has done very well in the last 12 months with EA. But in addition to that historical performance, the uptrend since January is still intact, and the recent April pre-breakout highs are now acting as support.
The idea here is a quick flip, though I may or may not use FPC on this one depending on market conditions. If the flip ends up not being quick, I'll potentially tactically add to the position.
As always - this is intended as "edutainment" and my perspective on what I am or would be doing, not a recommendation for you to buy or sell. Act accordingly and invest at your own risk. DYOR and only make investments that make good financial sense for you in your current situation.

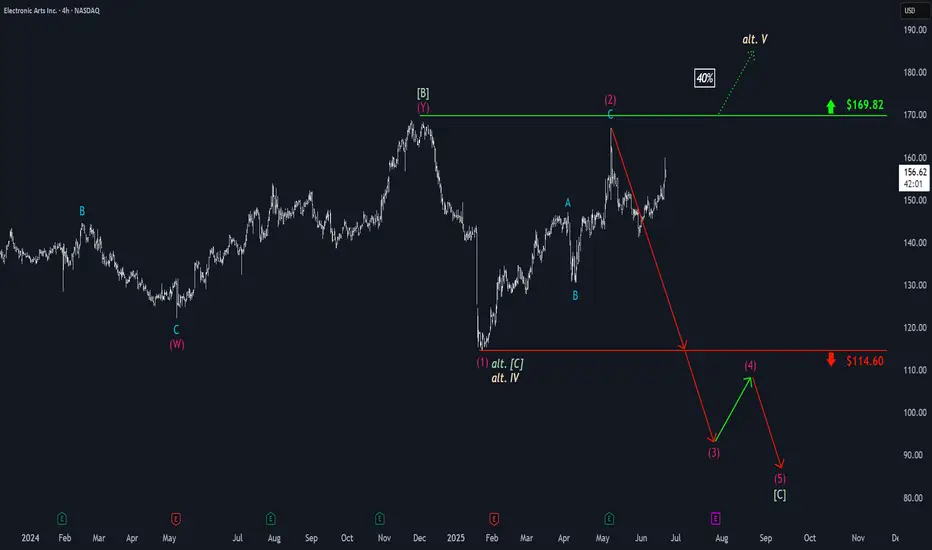
Electronic Arts: Jump!Recently, EA has made a strong upward jump, coming very close to the significant resistance at $169.82. However, the price quickly fell again, providing us with sufficient confirmation to consider the magenta wave (2) as completed. The current wave (3) should extend below the support at $114.60, and the subsequent wave (4) countermovement should also occur below this mark. With the final wave (5) of the magenta downtrend impulse, the larger green wave should then be completed. On the other hand, we see a 40% chance that EA has already completed the green wave alt. at $114.60 and will directly rise above the resistance at $169.82 during the beige wave alt. V .

Electronic Arts: A Leader in the Gaming IndustryElectronic Arts (EA) is a renowned game developer and publisher that's been around since 1982. Founded by William M. Hawkins III and William Gordon, the company has grown to become a major player in the gaming industry.
**What does EA do?**
* Develops and publishes games across various genres, including sports, action, role-playing, and simulation
* Owns popular brands like Battlefield, The Sims, Apex Legends, and Plants v. Zombies
* Licenses games to third parties, including FIFA, Madden NFL, and Star Wars
* Provides advertising services and digital distribution channels for its games
**How does EA reach its audience?**
* Markets and sells games through digital distribution channels and retail channels, such as mass-market retailers and game software specialty stores
EA has come a long way since its founding, and its commitment to innovation and quality has made it a leader in the gaming industry.

Electronic Arts Inc. Stock Sees Momentum Ahead of Earnings Electronic Arts Inc. (NASDAQ: NASDAQ:EA ) is gaining attention as the gaming industry shows signs of recovery. The stock closed at $142.93 on April 11, 2025, reflecting a gain of $3.54( 2.54%) for the day. Its next earnings report is scheduled for May 6, 2025.
The gaming industry grew rapidly during the COVID-19 pandemic but saw a decline as restrictions lifted. In 2024, inflation and lower spending led to layoffs and studio closures, though upcoming game releases may support a recovery.
EA is a major player in digital entertainment. It develops and distributes games across platforms, including consoles, mobile, and PCs. Popular titles in its lineup include EA SPORTS FC, Battlefield, Apex Legends, The Sims, Madden NFL, Need for Speed, Dragon Age, and Plants vs. Zombies. Billionaire investors continue to show confidence in EA, placing it among the top gaming stocks.
Technical Analysis
EA recently bounced sharply from the support zone around $115. This level aligns with a previous support zone. A strong bullish candle followed, with high volume pushing the price above key moving averages. Currently, EA trades near $143. The 50-day moving average is at $144.38, the 100-day at $141.01, and the 200-day at $133.68. These are levels that are likely to support the price in case of further declines.
The RSI stands at 52.41, showing neutral momentum. Next potential move suggests a short-term pullback before continuation. If the stock breaks above the immediate target and ascending trendline resistance, the next target lies near $168.50 previous high. EA is showing strength both fundamentally and technically as it approaches its next earnings release.

EA- Is it game on or turn the tv off for gaming?EA is breaking out of a trend. I am watching 119.80 and 131 for price action to tell me what to do. We should be able to hit PT1 just need to focus on getting best entry possible. GL!

ELECTRONICS ARTELECTRONICS ART
MTF Analysis Price
ELECTRONICS ARTYearly Demand 87
ELECTRONICS ART 6 Month Demand 87
ELECTRONICS ARTQtrly Demand BUFL 87
ELECTRONICS ARTMonthly Demand 129
ELECTRONICS ARTWeekly Demand 109
ELECTRONICS ARTDaily Demand DMIP 113
ENTRY -1 Long 113
SL 110
RISK 3
REWARD 112
Target as per Entry-1 225
RR 37
Last High 168
Last Low 110
ENTRY -2 Long 87
SL 77
RISK 10
REWARD 153
Target as per Entry-2 240
RR 15
Last High 168
Last Low 110
Trade Set Up
Buy Volume -1 As per Entry-1 1,000
Buy Volume -2 As per Entry-2 1,000
Average Buy Price 100
Trade Value 200,000
SL Point 77
RISK 23
Exit Target 240
Target Value 480,000
Profit Target 280,000
RISK Value 46,000
Risk to Reward 6

A Market Teetering on the Edge: Is EA Poised for a Rebound?With NASDAQ-EA trading at $118.70, down nearly 30% from its all-time high of $168.50 just 63 days ago, the market presents a mix of caution and intrigue. RSI levels languish deep in oversold territory, with daily RSI14 at an eye-popping 12.19—signaling potential exhaustion in bearish momentum. Add to this the emergence of high-volume buy signals, such as the VSA Buy Pattern Extra, hinting at possible accumulation near powerful support zones.
But here’s the burning question: Is this just a pause in the downtrend, or are we witnessing the groundwork for a bullish reversal? The price has been consolidating under key resistance at $126.40 while remaining well above the critical support at $113.57. As we dive into the charts, traders and investors alike must decide: Is this a time for patience, or a moment to seize the opportunity?
NASDAQ-EA Roadmap: A Path Through Patterns
Here’s how the recent market narrative unfolded for NASDAQ-EA, based on the patterns’ sequence and their main directions. Let’s walk through the roadmap of events to understand the technical dynamics and validate the signals.
1. VSA Buy Pattern Extra 1st – The Starting Signal
The session on 2025-01-23 10:00 UTC kicked off with a bullish VSA Buy Pattern. The pattern suggested an upward movement, confirmed by subsequent price action. The high of $143.27 aligned with the bullish prediction. The trigger was set at a low of $120.50, with the price bouncing back robustly.
Main Direction: Buy
Outcome: The next pattern supported the bullish trajectory, validating this pattern's forecast.
2. Sell Volumes Take Over – A Divergence in Direction
The next notable signal emerged on 2025-01-23 15:00 UTC, highlighting increased sell volumes. This suggested a bearish reversal from the earlier upward move. However, the market defied the expectation, holding the $126.4 support and continuing higher, indicating that the trigger failed to activate.
Main Direction: Sell
Outcome: Rejected – This pattern didn’t play out due to sustained bullish momentum.
3. Buy Volumes Max – A Bullish Confirmation
Following this, a strong Buy Volumes Max signal emerged on 2025-01-23 14:00 UTC, confirming the market’s intention to stay bullish. The price reached a high of $126.71, creating a significant movement upward. This pattern marked a key moment in establishing a robust upward trend.
Main Direction: Buy
Outcome: Confirmed – Momentum aligned with the forecast.
4. VSA Manipulation Buy Pattern Extra 1st – The Climax of Confidence
On 2025-01-23 17:00 UTC, another VSA Buy Pattern surfaced, affirming a long-term upward drive. The subsequent high of $130 reinforced this direction, proving its credibility. This pattern’s precision and alignment with previous signals made it a pivotal moment.
Main Direction: Buy
Outcome: Verified – Price action aligned perfectly, solidifying bullish confidence.
5. Increased Sell Volumes – A Temporary Reprieve
The market showed a shift on 2025-01-22 21:00 UTC, with an Increased Sell Volumes pattern. Despite a minor pullback to $120, the upward trend persisted, invalidating the bearish prediction. This marked the sellers’ inability to seize control.
Main Direction: Sell
Outcome: Failed – Price action rejected the bearish forecast.
Key Takeaways for Traders and Investors
Bullish patterns dominated the sequence, with successful confirmations in 3 out of 5 instances.
The alignment of VSA Buy Patterns highlighted the reliability of these signals for medium-term forecasts.
Failed bearish patterns suggest strong buying pressure, keeping the market in an upward trend.
Stay tuned for the next wave of market action! Whether you're riding the trend or waiting for the next pivot, these patterns provide a clear narrative for navigating NASDAQ-EA.
Technical & Price Action Analysis: Key Levels to Watch
The market’s dance around support and resistance zones can reveal its next moves. Let’s break down the levels currently steering NASDAQ-EA and how to approach them. Remember, if these levels don’t hold, they’ll flip into resistance, and the bulls or bears will have to face them again.
Support Levels to Keep on Your Radar
113.57 – A critical level; if it breaks, expect a retest to confirm resistance.
109.83 – A deeper pullback zone where buyers might reload if momentum weakens.
Resistance Levels to Break for Bullish Continuation
126.4 – The first line of defense for bears. A breakout here could ignite a stronger rally.
143.01 – A psychological zone tied to past highs; watch for reaction here.
145.79 – This level could be the gatekeeper for more significant upside potential.
Powerful Support Levels – Where the Big Boys Are Watching
144.61 – A make-or-break zone for bulls if the market revisits lower prices.
163.86 – The last stronghold for buyers, holding the line from deeper corrections.
Powerful Resistance Levels – Overhead Barriers
113.79 – If this flips, expect it to become a strong ceiling on pullbacks.
Pro Tip for Traders:
Levels don’t exist in isolation. Always look for price action confirmation—like wick rejections, candle closes, or volume spikes—when testing these zones. If you see these signs fail to hold, flip your mindset and consider these levels as the next barriers to overcome.
Trading Strategies with Rays: Precision Meets Probability
The "Rays from the Beginning of Movement" concept offers a robust approach to understanding market dynamics, providing clarity on probable price scenarios while avoiding the pitfalls of predicting exact levels. Let’s explore the concept, scenarios, and actionable trade setups.
Concept of Rays: The Fibonacci-Based Framework
Rays, based on Fibonacci mathematical and geometric principles, are dynamic tools that define key zones of price interaction. Each ray starts from the beginning of a movement, capturing the natural flow of the trend or correction. Here’s why this matters:
Dynamic Levels: Rays adapt to new patterns, keeping you ahead of the curve.
Clear Scenarios: Price interaction signals continuation or reversal, but only after interaction with a ray.
Directional Guidance: Moving averages (MA50, MA100, MA200, and MA233) enhance ray analysis, acting as dynamic support or resistance.
Why Focus on Probability, Not Precision?
The nonlinear nature of financial markets makes predicting exact levels unfeasible. Instead, rays reveal key zones where price interaction is likely. This simplifies decision-making and identifies high-probability trade setups.
Optimistic Scenario: Bulls Regain Control
First Target: $126.4 – Interaction with this ray and support from MA50 signals a breakout opportunity.
Second Target: $143.01 – Sustained momentum leads to this resistance zone, amplified by MA100 convergence.
Third Target: $145.79 – Interaction here suggests another leg upward, with potential consolidation around MA200 for further continuation.
Pessimistic Scenario: Bears Take the Wheel
First Target: $113.57 – A breakdown below this ray opens a move to this support.
Second Target: $109.83 – Failure at MA50 and interaction with this ray could accelerate downward momentum.
Third Target: $108.53 – Price interaction signals potential bottoming, but further selling pressure could test this absolute low.
Suggested Trade Setups: From Ray to Ray
Buy at $126.4: Enter on a breakout above this ray with MA50 support. Target $143.01, with $145.79 as the stretch goal.
Short at $126.4: If price rejects this ray, target $113.57 with a protective stop-loss above $126.4.
Buy at $113.57: Look for bullish price action signals after interaction. First target $126.4, second target $143.01.
Short at $143.01: If price fails to hold above this ray, target $126.4. For risk-takers, $113.57 offers a secondary target.
Key Takeaway for Traders:
Use ray interaction as your signal to act. Each move from ray to ray provides clarity on the next targets, with moving averages acting as dynamic guides. Adjust your position size and risk accordingly, but remember: patience pays when trading with rays.
Let’s Keep the Conversation Going!
Got questions about the analysis or want to discuss the roadmap in more detail? Drop your thoughts directly in the comments! I’m here to chat, clarify, and help you sharpen your trading game.
Don’t forget to Boost this post and save it to your favorites—it’s the best way to track how the price moves according to my layout. Understanding key levels and reaction points is essential for building confident trades, and I’d love for you to revisit this analysis later to see how it played out.
For those of you intrigued by my Rays and Levels Strategy, here’s the insider tip: the indicator automatically maps out all these zones, but it’s currently available in Private Only. If you’re interested in using it, feel free to message me directly, and we can discuss access options.
If you’d like custom analysis on a specific asset, I can make it happen! Some requests I’m happy to share for free with the community, while others can remain private just for you—perfect if you want to keep your edge to yourself. Either way, let’s collaborate to make your trading more precise.
Rays work on all assets, from stocks to crypto, and I’m happy to mark them up for you. Just Boost this post, write your request in the comments, and I’ll get to it as soon as I can.
And, of course, make sure to follow me here on TradingView to stay updated on my latest ideas, strategies, and insights. Trading is a journey, and I’d be thrilled to have you along for the ride! 🚀

Electronic Arts: Heading DownwardWe assume that EA’s recent high at $169.82 marked the completion of a prominent wave in green. This top stands out because it represents a typical corrective pattern where a seemingly new uptrend is simulated. Unlike a standard B wave, an overshooting B wave can significantly exceed the prior peak – in EA’s case, the last major high of July 2018. We primarily locate the stock in an extended correction, whereby a magenta downward impulse should push the price below the support at $108.62. However, if EA breaks decisively above the $169.82 resistance in the near term, we will switch to our 33% likely alternative scenario and reckon with further rises.

Electronic Arts Inc. (EA) 20% upPrice Target Analysis:
Key Levels:
Primary Target: $176.83 (1.0 Fibonacci Extension) with a 75% probability.
Extended Target: $196.46 (1.618 Fibonacci Extension) with a 60% probability.
Support Zones:
Immediate support at $145.06 (0.459 Fibonacci).
Critical support at $138.38 (key invalidation level).
Elliott Wave Projection:
Wave 4 correction completed.
Anticipated Wave 5 movement toward $176.83 and possibly extending to $196.46.
Momentum:
Current trajectory supported by strong bullish momentum post-correction.
Scenarios:
Bullish Case: Continuation toward $176.83 and potentially $196.46.
Bearish Case: Breakdown below $138.38, invalidating the bullish scenario.
Conclusion:
First Target: $176.83 (~20% potential gain).
Extended Target: $196.46 (~33% potential gain).
Disclaimer:
This is not financial advice. Conduct your research and consult a financial advisor before making investment decisions. 📊

$eai will try to go long here on SET:EA , risk 2-3% and upside target is+ 13% like the odds here! we have support zone here

Electronic Arts Inc. | Chart & Forecast SummaryKey Indicators on Trade Set Up in General
1. Push Set Up
2. Range Set up
3. Break & Retest Set Up
Active Sessions on Relevant Range & Elemented Probabilities;
* Asian(Ranging) - London(Upwards) - NYC(Downwards)
* Weekend Crypto Session
# Trend | Time Frame Conductive | Weekly Time Frame
- General Trend
- Measurement on Session
* Support & Resistance
* Trade Area | Focus & Motion Ahead
# Position & Risk Reward | Daily Time Frame
- Measurement on Session
* Retracement | 0.5 & 0.618
* Extension | 0.786 & 1
Conclusion | Trade Plan Execution & Risk Management on Demand;
Overall Consensus | Buy

$EA is now on my campaign trading list!"EA is a video game stock with the potential for a bullish breakout from a big base going back to mid 2018. Holding above 144-143 would keep a 2022 into 2024 base breakout intact and favor upside beyond 150-153.50, which would confirm the bigger 6-year base pattern. This would favor upside to 177 (upside count for the 2022-2024 base pattern) and then higher with the upside counts for the 6-year base at 215 and 226. Rising weekly MAs from 142 to 132 reinforce the bullish backdrop for EA.
EA improves and attempts a bullish turn relative to the SPX.

$EA SPORTS - ITS IN THE GAMESET:EA SPORTS - ITS IN THE GAME
Chart speaks for itself.
Volume diagonal offers another safety cull line in the event this does not play out.
PUKA

EA has some potential upside as the trend is risingEA has potential to rise on the upside as there is potential on the upside seeing the penetration of the Bollinger Band and also the rising of the trend

Electronic Arts (EA) | Finally a Confirmed Breakout!Hi,
Electronic Arts (EA) has finally made a statement. For over 6 years it has tried to break above $150. Multiple failed attempts before the 2024 July close which was the confirmation for a possible further growth.
This is a perfect example of how you should wait for a breakout. Let the other investors show you what might happen next. They were willing to pay prices that have never been paid per share and we take it as a strong statement, monthly close is the confirmation, and who want to jump in then there is the possibility.
Quite a similar price action to my earlier post about Mastercard (MA):
Good luck,
Vaido

$EA Going to tank within the next 6-18 monthsAsAs I continue to study the market, I can't help but notice so many stocks are in outrageous ATH Levels, in such a way that I can't help but believe the market will undergo a Price Correction that will in fact catch many off guard. Who am I to say though? Just an average man with an average brain. As far as levels, If we cannot hold above May Highs, Price should retreat to below May Lows. This could be a once in a lifetime opportunity to grab long puts , Leap puts are extremely safe here imo. Good Luck.

Buying EA what do you guys think of buying EA? Looks like the stock market wants to go up. Remember this week EA earnings will be out

Intraday, Swing trade setup in Electronic Arts Inc (EA)NASDAQ:EA
Entry: 127.24
Target: 128.85
Stop-loss according to your risk appetite. Not more than 1:1.
Indicators also showing a bullish trend.
Trade will become invalid if the stock goes below $ 125.11 first before the entry level.

