Short ENPH - Overdone rally from earning catalystOverall market rally seems way overdone and overhyped, although congress continue to press for stimulus bills on energy sector; still upside risk to reward does not warrant a long position at this point in time.
Rather, market's current rally are living on pro-longed extension from recovering CPI data to positive earning outlook to stock split. These catalyst seems to have very much been priced.
ENPH trade ideas

ENPH - Dream pattern before earning Cup and Handle dream pattern with triangle handle. Earnings history very strong beating estimates consistently.
You don't need to know what's going to happen next to make money ~Mark Douglas
Lose like a pro and keep trading, or lose like a novice and quit ~Mark Ritchie


Is This Sustainable?Price is well over the bands set on 80. Chances are very high that price will eventually pull back to the interior of the bands.
ENPH broke up from a possible bullish bat a while back.
Earnings beat that was obviously well received.
Gap below price that may cause price to pause as it could serve as a level of support.
Possible W extension pattern formed and may have landed just above the 200% mark. Remarkable to say the least.
Short is approximately 3.43%.
Price is up in la la land after a new ATH and this could even pull back and make another run for it.
Time will tell.
No recommendation/be safe
Bearish Harami on daily at this moment/Doji on weekly and monthly charts representing indecision.
Possible short for the near term. I plan to revisit this one

ENPH Enphase Energy got electric charged!This came up on my screener... ENPH
Reading abotut it was intriguing as this was interesting as it develops, manufactures, and sells solar microinverters, energy monitoring software, and battery storage products. Given the expected surge of crude after the current retracement, and the sustainability trend, I find ENPH intriguingly positioned.
Technicals flagged it out, having taken some damage since Oct 2021. A triangle formation breakout, and retest appears to have been done and a second breakout (of a trendline) flagged it. The daily technical indicators are turning up to support the breakout.
On the news front, apparently solar stocks were given a boost with Biden's announcement where there would not be any new tariffs on solar imports for the next two years. In addition, There was authorization for Defense Production Act to help US manufacturers of solar panels, and it is expected that US solar manufacturing capacity can triple in the next two years. People would need energy management tools!
Looks delicious...
Potential upside target based on triangle breakout projections put it at 360 in Nov 2022. An interesting proposition seen in this chart.

ENPH M-pattern targets 328 if it BO of 283 D.top OR 222 retest?TAN solar etf together with its main component ENPHASE energy has been on a tear lately. ENPH made a W-pattern in 2021 & is again repeating it this 2022. It currently made a double top at 283 but shows no sign of rejection yet. If it retraces then the W=neck at 222 will be retested. But if it breaks above 328, then the Fib 1.272 at 328 will be the next target.
Not trading advice

ENPH NASDAQ:ENPH has had a great run, breaking above the resistance level with a decent volume. Most US solar stocks have done well this week. It's probably a good thing for NASDAQ:ENPH

ENPH7'.27.22 ENPH Gap hire today. I wouldn't take a trade today. The video explains how I would approach it.

ENPH - rally into earnings?ENHP looks much stronger than the overall market.
Earnings history is very strong beating estimates consistently.
Less than 25% to ATH.
Took a hit on Jul,15 on solar negative news and recovered very quickly.
I expect it to go at least to ATH.

ENPH- Triangle Breakout - UpdateThe solar sector has been leading the broader markets for some time now, very much eyeing ENPH along with some others in the sector for a run-up & breakout prior to, and after their earnings. ENPH is holding a big symmetrical triangle on the daily timeframe after closing on Friday sitting on its 20-Day SMA. ENPH additionally has some nice bullish divergence on the RSI on the daily timeframe, as well as holding an ascending triangle on the 4-Hour timeframe after forming a bullish butterfly harmonic pattern (See Attached Chart Below). Bullish and will be looking for a breakout from this triangle (Broader Market Conditions Permitting)- Just some support and resistance levels to watch along with some RSI-based supply and demand zones to keep an eye on in the meantime- See previous charts attached below for previous price targets.
4-Hour Timeframe
--Previously Charted--
PT1- $198.17
PT2- $200.85
PT3- $203.22
PT4- $206.60 +

Enphase Energy: Tight Consolidation & Golden CrossSolar energy has been one of a few bright spots in this bearish market. Today we’re looking at the company in the group with the largest market cap: Enphase Energy (ENPH).
The first pattern on this daily chart is the uptrend since mid-May -- the opposite of the broader market’s price action. In fact, ENPH hasn’t made a new 52-week low in 117 sessions. (The S&P 500 last made a new low 16 candles ago.)
Next is the tight consolidation illustrated by Bollinger Bands Width.
Third, you have the level around $220. ENPH probed and reversed at this area in April, June and July. But combined with the uptrend and narrowing price range, traders may look for a breakout if prices manage to cross this resistance. That could be especially true with earnings expected later this month.
Finally, notice how the 50-day simple moving average (SMA) is just now rising above the 200-day SMA. That kind of “golden cross” may signal that the longer-term trend is getting more positive. (Only 10 percent of the S&P 500 have their 50-day SMAs above the 200-day SMAs, according to TradeStation data.)
TradeStation has, for decades, advanced the trading industry, providing access to stocks, options, futures and cryptocurrencies. See our Overview for more.
Important Information
TradeStation Securities, Inc., TradeStation Crypto, Inc., and TradeStation Technologies, Inc. are each wholly owned subsidiaries of TradeStation Group, Inc., all operating, and providing products and services, under the TradeStation brand and trademark. You Can Trade, Inc. is also a wholly owned subsidiary of TradeStation Group, Inc., operating under its own brand and trademarks. TradeStation Crypto, Inc. offers to self-directed investors and traders cryptocurrency brokerage services. It is neither licensed with the SEC or the CFTC nor is it a Member of NFA. When applying for, or purchasing, accounts, subscriptions, products, and services, it is important that you know which company you will be dealing with. Please click here for further important information explaining what this means.
This content is for informational and educational purposes only. This is not a recommendation regarding any investment or investment strategy. Any opinions expressed herein are those of the author and do not represent the views or opinions of TradeStation or any of its affiliates.
Investing involves risks. Past performance, whether actual or indicated by historical tests of strategies, is no guarantee of future performance or success. There is a possibility that you may sustain a loss equal to or greater than your entire investment regardless of which asset class you trade (equities, options, futures, or digital assets); therefore, you should not invest or risk money that you cannot afford to lose. Before trading any asset class, first read the relevant risk disclosure statements on the Important Documents page, found here: www.tradestation.com .

ENPH breakout (long trade)Enphase Energy is a solar stock setting up in a textbook breakout pattern. Pullbacks have shallowed from over 50% at the start of the bear market down to 14%. This volatility compression shows accumulation in the stock and a transfer from weak hands to strong.
The numbers are tremendous on this one. As you can see from the MarketSmith numbers at the bottom of the chart, sales and earnings are growing at an extraordinary rate for the last four quarters. 2022 estimates are for a 45% increase in EPS and another 24% increase is expected in 2023.
Relative strength ranks at 97/100 and the solar sector as a whole is the top-performing sector right in the market right now. A strong stock in a strong sector at the start of a new bull market is the formula for knocking down triple digit gains, and this stock could very well deliver.
I'm looking for a breakout above the $220 level to trigger the buy. A move on increased volume would give me even higher conviction.

time to dump after double top? 🐻double top, rsi resistance, lower high and low volume in general! hard to be bullish on this name right now.
watching for move above 221.80 for longs, failure to breakout means a move to 152-119-86 may come in near future.

Buy ENPH (above the MA 35)I bought ENPH because its price is above the MA 35/13 and above the trend line.
My stop $168 and target $220 is on the chart. MM 1.67

$ENPH Strong Relative Strength$ENPH I am already Long this name and added this morning. Still only ½ size position in this wild market. This name has been showing Relative Strength for some time now as is the whole solar sector. I have my relevant notes on the chart. I expect the next level of resistance will be in the $216 area. If it can get above that I think a reasonable target area is $250 to $280 area. I’ll be looking to add over the $216 area if it can get there. Ideas, not investing / trading advice.

ENPH: repetitive price action?The black arrows might unfold as similar price actions.
Below 194.00 supports a bearish trend direction. Crossing above this level will negate the bearish stance.
Further support from 179.75 for further downside potential.
Consolidation price action between 169.75 and 186.00.
Crossing below 169.75 might target 153.25 (to complete the repetitive price pattern).
A break above 186.00 will be the first sign of strength returning to the stock.

ENPH - Acting As a FlagA major Trend Line reclamation has taken place on ENPH ,
right now the price above the trend line is acting as a flag from a bullflag
I expect bullish results due to this major Trend Line reclamation

ENPH holds better than TAN;if mid165 fails, 120 will be retestedENPHASE is holding better than its mother ETF, TAN. Since 2021, it has basically been consolidating horizontally except for an overshoot 4Q2021. In contrast, the TAN etf is in a falling wedge formation.
BULLISH CASE: Better yet, it is holding above the middle of this conso box, the 165 to 170 zone. (Middle of 120 to 220). This is also a convergence of 3 VWAPs from recent highs & recent bottoms. If it holds 165, then 220 will be retested.
BEARISH CASE: If this midzone is lost, then a retest of 120 will be next or even a double bottom sometimes in 3Q2022 to create a divergence.
Not trading advice

ENPH Pulling Back to Pivot SupportThere is nothing to do come Monday and I will probably sit out until FED notes are out Wed.
That said, One of the stocks I'll be keeping an eye on is $ENPH pulling back to double bottom traditional pivot.
Weekly chart (not shown here) indicates it needs a bit more work.
ENPHase W-pattern may reach 328 for wave 5 if 200 holdsENPH is the strongest component of the TAN solar ETF. Just like the biotech sector, it has started to gain ground after a long hammer candle at the week of May 9,2022. Since then it bounced with 4 consecutive green weekly candles from 165, the middle of a big trading range since 2021 (110-210).
BULLISH CASE: ENPH is now at 210 the top of the range. It may retrace back down & retest the 165 midpoint or the VWAPs before a rally to again BO the 200 to 210 red zone with 328 as the destination of its wave V. This assumes that wave IV is a running flat & the 5-wave wave V is underway. It is now at the wave 3 of a bigger wave V.
BEARISH CASE got hammered when ENPH bounce above all my VWAPs & is now attempting to breakout the 200-210 red zone.
Not trading advice

$ENPH Analysis, Key Levels, and Targets (REQUEST)$ENPH Analysis, Key Levels, and Targets
I had a super fun time analyzing this chart mostly because I’ve never seen it before. Energy is hot right now so I see why it was requested.
The general direction is up. And there is lots of support… The gap up today forms a nice possible support. If there’s a little pull back, I’d go long… (You trade, right? Or are you looking for a long entry??) Thanks for the prompt and I like this chart… I added it to my watchlist…
Get above 220, and then fly to 280…
Hope this helps...
—-
I am not your financial advisor. Watch my setups first before you jump in… My trade set ups work very well and they are for my personal reference and if you decide to trade them you do so at your own risk. I will gladly answer questions to the best of my knowledge but ultimately the risk is on you. I will update targets as needed.
GL and happy trading.
IF you need anything analyzed Technically just comment with the Ticker and I’ll do it as soon as possible…

Enphase USA Sun Storm Investment Trading Desk & NexGen Wealth Management Service Present's: SSITD & NexGen Portfolio of the Week Series
Focus: Worldwide
By Sun Storm Investment Research & NexGen Wealth Management Service
A Profit & Solutions Strategy & Research
Trading | Investment | Stocks | ETF | Mutual Funds | Crypto | Bonds | Options | Dividend | Futures |
USA | Canada | UK | Germany | France | Italy | Rest of Europe | Mexico | India
Disclaimer: Sun Storm Investment and NexGen are not registered financial advisors, so please do your own research before trading & investing anything. This is information is for only research purposes not for actual trading & investing decision.
#debadipb #profitsolutions

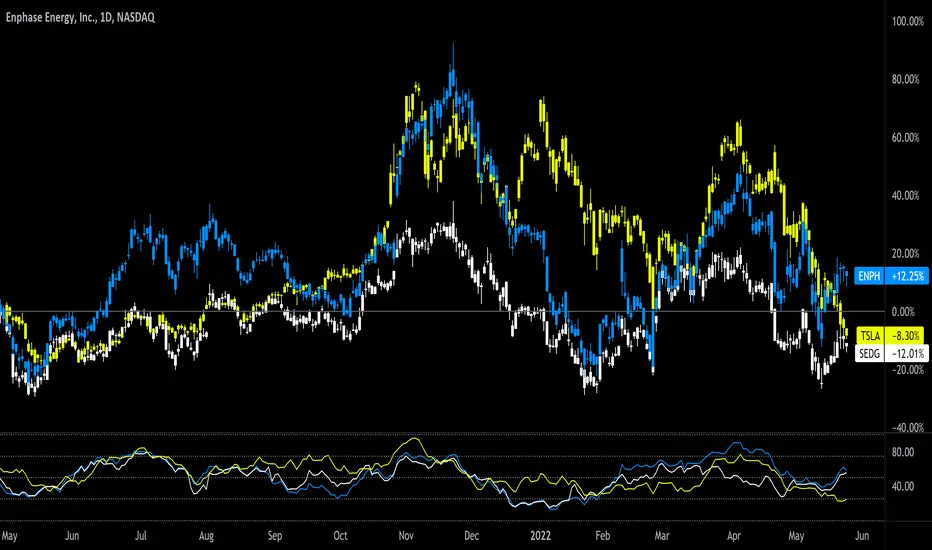
Solar comparisonSolar company comparison YTD:
ENPH +11.96%
TSLA -8.59%
SEDG -12.42%
Do your own due diligence, your risk is 100% your responsibility. This is for educational and entertainment purposes only. You win some or you learn some. Consider being charitable with some of your profit to help humankind. Good luck and happy trading friends...
*3x lucky 7s of trading*
7pt Trading compass:
Price action, entry/exit
Volume average/direction
Trend, patterns, momentum
Newsworthy current events
Revenue
Earnings
Balance sheet
7 Common mistakes:
+5% portfolio trades, capital risk management
Beware of analyst's motives
Emotions & Opinions
FOMO : bad timing, the market is ruthless, be shrewd
Lack of planning & discipline
Forgetting restraint
Obdurate repetitive errors, no adaptation
7 Important tools:
Trading View app!, Brokerage UI
Accurate indicators & settings
Wide screen monitor/s
Trading log (pencil & graph paper)
Big, organized desk
Reading books, playing chess
Sorted watch-list
Checkout my indicators:
Fibonacci VIP - volume
Fibonacci MA7 - price
pi RSI - trend momentum
TTC - trend channel
AlertiT - notification
tickerTracker - MFI Oscillator
www.tradingview.com