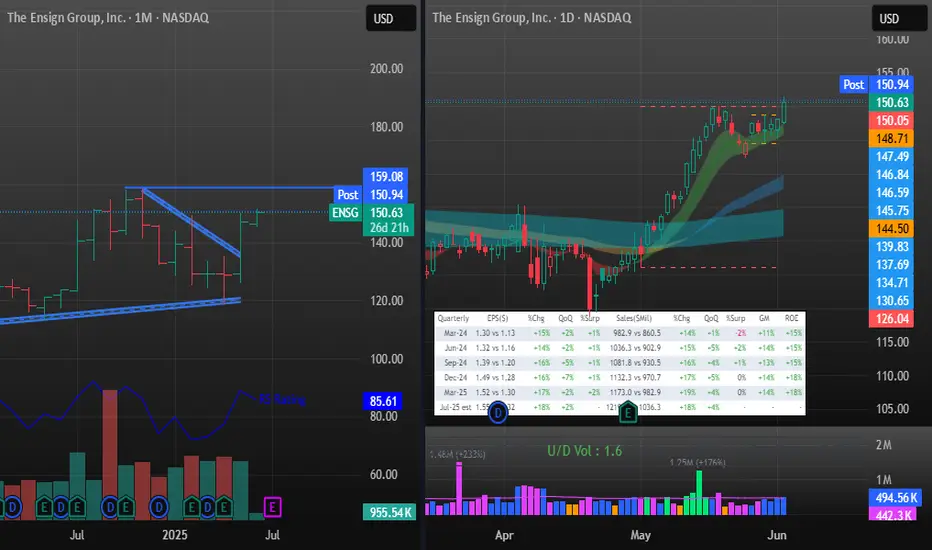
$ENSG Great Fundamentals and Technicals lining up for ATH testAnnual Revenue (2024): $4.26 billion, a 14.2% increase year-over-year from 2023.
Quarterly Revenue (Q4 2024): $1.13 billion, up 15.5% from the prior year quarter, though slightly below analyst estimates of $1.39 billion.
Q1 2025 Revenue: $1.17 billion, a 16.1% increase from Q1 2024, reflecting str
Next report date
—
Report period
—
EPS estimate
—
Revenue estimate
—
5.69 USD
297.97 M USD
4.26 B USD
55.67 M
About The Ensign Group, Inc.
Sector
Industry
CEO
Barry R. Port
Website
Headquarters
San Juan Capistrano
Founded
1999
FIGI
BBG000K1T9L0
The Ensign Group, Inc. engages in providing skilled nursing, senior living, and rehabilitative care services. It operates through the Skilled Services and Standard Bearer segments. The Skilled Services segments includes the operation of skilled nursing facilities and rehabilitation therapy services. The Standard Bearer segment refers to the leasing to skilled nursing and senior living operations. The company was founded by Roy E. Christensen, Christopher R. Christensen, and Gregory K. Stapley in 1999 and is headquartered in San Juan Capistrano, CA.
Related stocks
CypherStop below 4thleg down.
Healthcare stock that I hold. If I see a bad pattern, I sell part of it.
A cypher pattern has peak 2 higher than peak 1 like a shark but the Bullish Cypher terminates at the .786 on the 4th leg of the crooked M pattern. A Shark terminates at the .886 of the 1.113 of the 1

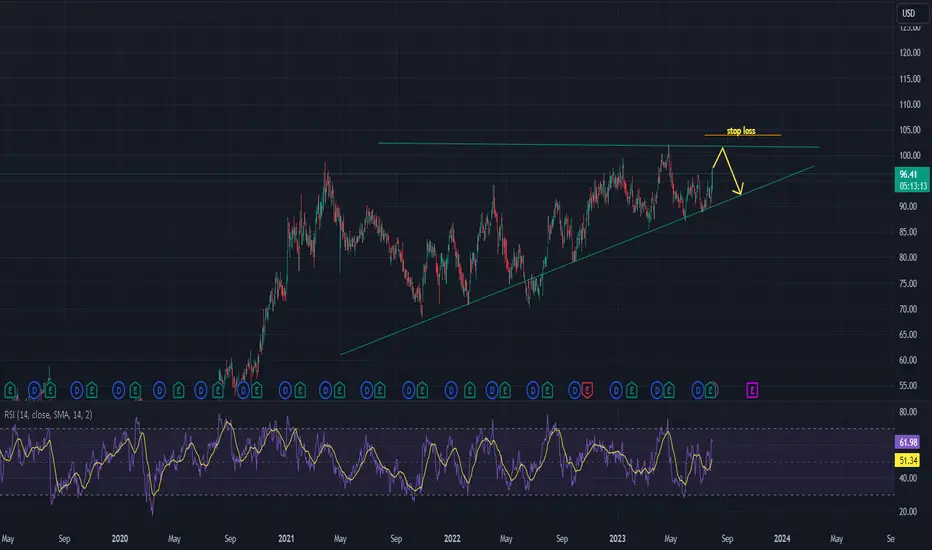
ENSG short On the chart we can see an ascending triangle, which is a bullish pattern. We are expecting that the price will continue going higher towards resistance.
Short at the resistance with the target at the upsloping support line.
The stop loss should be places above the resistance.
SHARK/BULLISHI am not sure healthcare is in rotation yet, and I am not sure AI if finished mountain climbing yet.
However this a Shark and is a bullish M pattern which reverses at the bottom of the 4th leg. It did.
Sharks have no rules for where leg 2 (the pull back leg of leg 1) lands. However peak 2 is alw

Channel DownChannels switch directions a lot as of late.
A break of the channel like signals a move in that direction.
A channel down is a channel down until it becomes a channels up (o:
No recommendation.
I like this stock but healthcare was traded to the mas a month or 2 ago. Now it pays it's dues I suppose

$ENSG poised to go higher from here?Notes:
* Very strong up trend on the weekly/monthly charts
* Great earnings for the past few years
* Basing for the past 19 months
* Creating a cup and handle
* Trying to break out of the handle
* Strong resistance around the $85.4 area
Technicals:
Ticker: $ENSG
Sector: Healthcare - Medical Care

Possible Head and Shoulders x 2ENSG has already had a H&S pattern and recovered. Price has not made back up to the old head of this pattern and the high of 94.25.
This pattern is only valid with a clean break of the neckline and a downtrend. Sometimes there will be a retest of the neckline. Sometimes there may be a huge sell

Cup and HandleThis is a healthcare stock I hold.
ENSG has had a rough few months but had a lot of gains earlier so this does happen.
Too get targets for a cup and handle, you can get the cup depth and apply fib levels, then add it to long entry level
No recommendation

The Ensign Group Reports Third Quarter 2021 Results; Increases 2ENSG: The Ensign Group, Inc.
2021-10-27 16:09:38
The Ensign Group Reports Third Quarter 2021 Results; Increases 2021 Earnings Guidance and Announces formation of a Captive REIT

Head and ShouldersStrong stock and one on my long term holds. It just kinda makes you go OUCH when you see this.
I was stopped out in one of my accounts on FRIDAY. ENSG took a look dip via a long legged doji. Long legged dojis can definitely find a support level. It is a good thing that it dropped over 10 bux an

See all ideas
Summarizing what the indicators are suggesting.
Neutral
SellBuy
Strong sellStrong buy
Strong sellSellNeutralBuyStrong buy
Neutral
SellBuy
Strong sellStrong buy
Strong sellSellNeutralBuyStrong buy
Neutral
SellBuy
Strong sellStrong buy
Strong sellSellNeutralBuyStrong buy
An aggregate view of professional's ratings.
Neutral
SellBuy
Strong sellStrong buy
Strong sellSellNeutralBuyStrong buy
Neutral
SellBuy
Strong sellStrong buy
Strong sellSellNeutralBuyStrong buy
Neutral
SellBuy
Strong sellStrong buy
Strong sellSellNeutralBuyStrong buy
Displays a symbol's price movements over previous years to identify recurring trends.
Frequently Asked Questions
The current price of ENSG is 147.78 USD — it has decreased by −1.52% in the past 24 hours. Watch The Ensign Group, Inc. stock price performance more closely on the chart.
Depending on the exchange, the stock ticker may vary. For instance, on NASDAQ exchange The Ensign Group, Inc. stocks are traded under the ticker ENSG.
ENSG stock has risen by 8.10% compared to the previous week, the month change is a −3.96% fall, over the last year The Ensign Group, Inc. has showed a 5.41% increase.
We've gathered analysts' opinions on The Ensign Group, Inc. future price: according to them, ENSG price has a max estimate of 185.00 USD and a min estimate of 161.00 USD. Watch ENSG chart and read a more detailed The Ensign Group, Inc. stock forecast: see what analysts think of The Ensign Group, Inc. and suggest that you do with its stocks.
ENSG reached its all-time high on Nov 6, 2024 with the price of 158.45 USD, and its all-time low was 1.99 USD and was reached on Mar 6, 2008. View more price dynamics on ENSG chart.
See other stocks reaching their highest and lowest prices.
See other stocks reaching their highest and lowest prices.
ENSG stock is 2.36% volatile and has beta coefficient of 0.34. Track The Ensign Group, Inc. stock price on the chart and check out the list of the most volatile stocks — is The Ensign Group, Inc. there?
Today The Ensign Group, Inc. has the market capitalization of 8.53 B, it has decreased by −4.03% over the last week.
Yes, you can track The Ensign Group, Inc. financials in yearly and quarterly reports right on TradingView.
The Ensign Group, Inc. is going to release the next earnings report on Oct 22, 2025. Keep track of upcoming events with our Earnings Calendar.
ENSG earnings for the last quarter are 1.59 USD per share, whereas the estimation was 1.55 USD resulting in a 2.49% surprise. The estimated earnings for the next quarter are 1.60 USD per share. See more details about The Ensign Group, Inc. earnings.
The Ensign Group, Inc. revenue for the last quarter amounts to 1.23 B USD, despite the estimated figure of 1.22 B USD. In the next quarter, revenue is expected to reach 1.28 B USD.
ENSG net income for the last quarter is 84.40 M USD, while the quarter before that showed 80.28 M USD of net income which accounts for 5.13% change. Track more The Ensign Group, Inc. financial stats to get the full picture.
Yes, ENSG dividends are paid quarterly. The last dividend per share was 0.06 USD. As of today, Dividend Yield (TTM)% is 0.17%. Tracking The Ensign Group, Inc. dividends might help you take more informed decisions.
The Ensign Group, Inc. dividend yield was 0.18% in 2024, and payout ratio reached 4.74%. The year before the numbers were 0.21% and 6.36% correspondingly. See high-dividend stocks and find more opportunities for your portfolio.
As of Jul 29, 2025, the company has 39.3 K employees. See our rating of the largest employees — is The Ensign Group, Inc. on this list?
EBITDA measures a company's operating performance, its growth signifies an improvement in the efficiency of a company. The Ensign Group, Inc. EBITDA is 491.23 M USD, and current EBITDA margin is 10.45%. See more stats in The Ensign Group, Inc. financial statements.
Like other stocks, ENSG shares are traded on stock exchanges, e.g. Nasdaq, Nyse, Euronext, and the easiest way to buy them is through an online stock broker. To do this, you need to open an account and follow a broker's procedures, then start trading. You can trade The Ensign Group, Inc. stock right from TradingView charts — choose your broker and connect to your account.
Investing in stocks requires a comprehensive research: you should carefully study all the available data, e.g. company's financials, related news, and its technical analysis. So The Ensign Group, Inc. technincal analysis shows the buy rating today, and its 1 week rating is buy. Since market conditions are prone to changes, it's worth looking a bit further into the future — according to the 1 month rating The Ensign Group, Inc. stock shows the buy signal. See more of The Ensign Group, Inc. technicals for a more comprehensive analysis.
If you're still not sure, try looking for inspiration in our curated watchlists.
If you're still not sure, try looking for inspiration in our curated watchlists.