$ENZL Starting to look good here, tightening wedge with buying.Plenty of buy volume recently to break this wedge. looking for a jump soon.
Key stats
About iShares MSCI New Zealand ETF
Home page
Inception date
Sep 1, 2010
Structure
Open-Ended Fund
Replication method
Physical
Dividend treatment
Distributes
Distribution tax treatment
Qualified dividends
Income tax type
Capital Gains
Max ST capital gains rate
39.60%
Max LT capital gains rate
20.00%
Primary advisor
BlackRock Fund Advisors
Distributor
BlackRock Investments LLC
ENZL provides exposure to the New Zealand equity space, which has had limited choices. ENZL represents concentrated exposure to the top names moving the New Zealand economy. Stocks are selected based on market-cap, liquidity measures, and fundamental characteristics. Single issuers are capped to 22.5% allocation in the portfolio and group entities to 45%. ENZL uses a representative sampling strategy, which means it will invest in a sample of securities that collectively have an investment profile similar to that of the underlying index. The portfolio manager may use futures, options, swaps, cash equivalents, and securities lending to manage the portfolio. The index is rebalanced quarterly. Prior to Sept. 3, 2024, the fund tracked the MSCI New Zealand IMI 25/50 Index.
Related funds
Classification
What's in the fund
Exposure type
Health Technology
Transportation
Utilities
Finance
Miscellaneous
Stock breakdown by region
Top 10 holdings

$ENZL Possible H&S here, should drop to trend line if so.Looking for a drop here, from that weak last monthly doji.
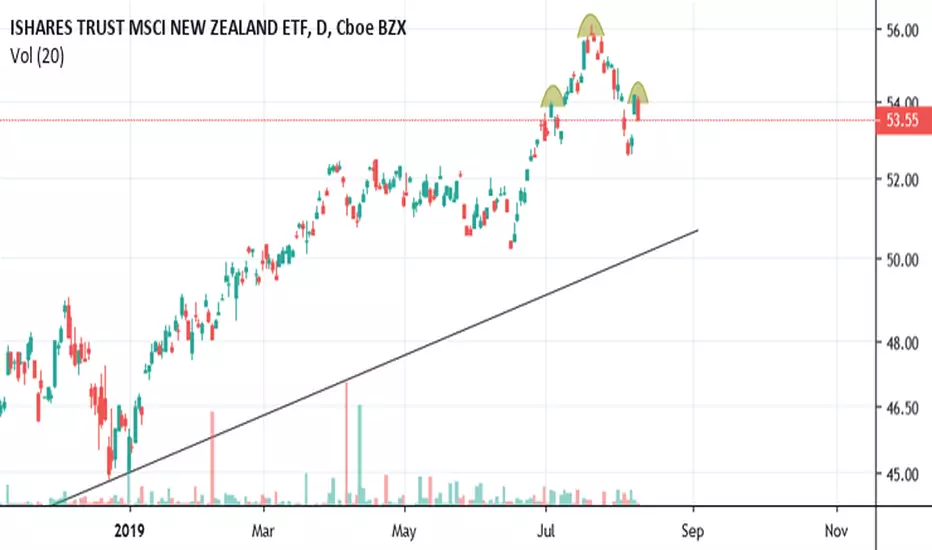


ENZL: Compelling top spottedWe can go short ENZL at market, and aim for a significantly large target.
Stops should be above this week's high (trading range).
Expecting to see a sharp decline to ensue here in the intermediate term.
If interested in my trading signals, or in personal tuition, contact me privately. I'm offering

See all ideas
Summarizing what the indicators are suggesting.
Oscillators
Neutral
SellBuy
Strong sellStrong buy
Strong sellSellNeutralBuyStrong buy
Oscillators
Neutral
SellBuy
Strong sellStrong buy
Strong sellSellNeutralBuyStrong buy
Summary
Neutral
SellBuy
Strong sellStrong buy
Strong sellSellNeutralBuyStrong buy
Summary
Neutral
SellBuy
Strong sellStrong buy
Strong sellSellNeutralBuyStrong buy
Summary
Neutral
SellBuy
Strong sellStrong buy
Strong sellSellNeutralBuyStrong buy
Moving Averages
Neutral
SellBuy
Strong sellStrong buy
Strong sellSellNeutralBuyStrong buy
Moving Averages
Neutral
SellBuy
Strong sellStrong buy
Strong sellSellNeutralBuyStrong buy
Displays a symbol's price movements over previous years to identify recurring trends.
Frequently Asked Questions
An exchange-traded fund (ETF) is a collection of assets (stocks, bonds, commodities, etc.) that track an underlying index and can be bought on an exchange like individual stocks.
ENZL trades at 45.87 USD today, its price has fallen −0.54% in the past 24 hours. Track more dynamics on ENZL price chart.
ENZL net asset value is 45.94 today — it's risen 1.25% over the past month. NAV represents the total value of the fund's assets less liabilities and serves as a gauge of the fund's performance.
ENZL assets under management is 73.67 M USD. AUM is an important metric as it reflects the fund's size and can serve as a gauge of how successful the fund is in attracting investors, which, in its turn, can influence decision-making.
ENZL price has risen by 1.45% over the last month, and its yearly performance shows a 1.69% increase. See more dynamics on ENZL price chart.
NAV returns, another gauge of an ETF dynamics, have risen by 1.25% over the last month, showed a 5.91% increase in three-month performance and has increased by 2.65% in a year.
NAV returns, another gauge of an ETF dynamics, have risen by 1.25% over the last month, showed a 5.91% increase in three-month performance and has increased by 2.65% in a year.
ENZL fund flows account for −11.14 M USD (1 year). Many traders use this metric to get insight into investors' sentiment and evaluate whether it's time to buy or sell the fund.
Since ETFs work like an individual stock, they can be bought and sold on exchanges (e.g. NASDAQ, NYSE, EURONEXT). As it happens with stocks, you need to select a brokerage to access trading. Explore our list of available brokers to find the one to help execute your strategies. Don't forget to do your research before getting to trading. Explore ETFs metrics in our ETF screener to find a reliable opportunity.
ENZL invests in stocks. See more details in our Analysis section.
ENZL expense ratio is 0.50%. It's an important metric for helping traders understand the fund's operating costs relative to assets and how expensive it would be to hold the fund.
No, ENZL isn't leveraged, meaning it doesn't use borrowings or financial derivatives to magnify the performance of the underlying assets or index it follows.
In some ways, ETFs are safe investments, but in a broader sense, they're not safer than any other asset, so it's crucial to analyze a fund before investing. But if your research gives a vague answer, you can always refer to technical analysis.
Today, ENZL technical analysis shows the buy rating and its 1-week rating is buy. Since market conditions are prone to changes, it's worth looking a bit further into the future — according to the 1-month rating ENZL shows the neutral signal. See more of ENZL technicals for a more comprehensive analysis.
Today, ENZL technical analysis shows the buy rating and its 1-week rating is buy. Since market conditions are prone to changes, it's worth looking a bit further into the future — according to the 1-month rating ENZL shows the neutral signal. See more of ENZL technicals for a more comprehensive analysis.
Yes, ENZL pays dividends to its holders with the dividend yield of 1.55%.
ENZL trades at a premium (0.65%).
Premium/discount to NAV expresses the difference between the ETF’s price and its NAV value. A positive percentage indicates a premium, meaning the ETF trades at a higher price than the calculated NAV. Conversely, a negative percentage indicates a discount, suggesting the ETF trades at a lower price than NAV.
Premium/discount to NAV expresses the difference between the ETF’s price and its NAV value. A positive percentage indicates a premium, meaning the ETF trades at a higher price than the calculated NAV. Conversely, a negative percentage indicates a discount, suggesting the ETF trades at a lower price than NAV.
ENZL shares are issued by BlackRock, Inc.
ENZL follows the MSCI New Zealand All Cap Top 25 Capped Index - Benchmark TR Net. ETFs usually track some benchmark seeking to replicate its performance and guide asset selection and objectives.
The fund started trading on Sep 1, 2010.
The fund's management style is passive, meaning it's aiming to replicate the performance of the underlying index by holding assets in the same proportions as the index. The goal is to match the index's returns.