7/7/25 - $eose - Spec punt long ~$5/shr7/7/25 :: VROCKSTAR :: NASDAQ:EOSE
Spec punt long ~$5/shr
- at $5/shr (-ish) you get a company that will be ramping the living daylights out of revenue into 2h
- any battery tech that VST mgmt r referring to "domestic mfg" will benefit the entire sector, esp names like NASDAQ:EOSE w/ ample mfg and revenue already scaling
- obv. if it *is* Eos, well, see u at like *make up a number*
- batteries are the sector i am admittely not as smart on as i'd like to be, esp given my love for NASDAQ:NXT and to a slightly lesser degree NASDAQ:FSLR (and solar as a dominant generation tech in the coming decade)
- so here's to putting some skin in the game to force me to get smart faster than i'd otherwise do from the sidelines
- if you like quantum memes... how about a market cap w/ revenue, real world use case and exploding (actually, not made up) growth already in 2H with a chart that doesn't already look toppy/ or meme-esque
- what resources/ ppl should i follow to get smarter here?
V
EOSE trade ideas

Up 11.66% - What's happening with EOSE They show their cards with Volume. Follow the Master Pattern don't get in too early. Wait for confirmation on Three days of High Volume and Higher Highs. Read my last post.

EOSE Risks to Monitor🎯 Master Pattern Structure (daily → intraday)
Consolidation Phase
The stock has been range‑bound around the $4.00–$4.30 level over past days, with declining volume—classic base/range building. The setup aligns well with a textbook master pattern: base → liquidity grab → early breakout. Trend confirmation depends on holding key levels and volume surging north. Keep your stops tight and targets clearly defined.
| Stage | Status |
| ------------- | ------------------------- |
| Consolidation | ✔ In place |
| Sweep | ✔ Likely occurred June 11 |
| Expansion | ↗ Entry forming today |
Liquidity Sweep (False Breakout)
On June 11, EOSE “fell below its 200‑day MA (~$4.08) on lower volume”—likely a shake‑out of weak hands
. This aligns with a classic liquidity grab phase.
Expansion Phase Potential
Late today, price rebounded into the $4.20–$4.28 range on above‑average intraday volume (7.9 M vs avg ~11 M)
. That bounce—holding above pivot levels—can be the triggering expansion.
📊 Technical Indicators Snapshot (per Investing.com, as of June 12)
Daily Summary: Mixed to bullish—“Technical Indicators” show a Strong Buy bias, while Moving Averages are neutral (6 buy / 6 sell)
RSI (~54): Neutral, no clear overbought/oversold.
MACD (~0.05): Slightly bullish.
Stochastics: Overbought/slightly elevated—watch for pullback.
200‑day MA (~$5.38) & 100‑day (~$4.57) acting as resistance caps
📈 Entry & Targets
Intraday Entry Zone: $4.20–$4.25 — ideally on a pullback after current bounce.
Near-Term Target: $4.30–$4.40 (yesterday’s range top) — aligns with short‑term pivot R1.
Stretch Target: $4.57–$5.00 if momentum holds and it reclaims the 100‑DMA.
Stop Placement: Just below the recent sweep low at $3.88–$4.00.
⚠️ Risks to Monitor
Failing to hold $4.20 could indicate a false breakout and trigger retest of range bottom (~$3.75).
200‑day MA (~$5.38) remains a strong resistance barrier—momentum will likely fade unless the stock re-enters a sustained uptrend.
Broader market sentiment or sector-specific news (ESG/energy storage) could influence price sharply.


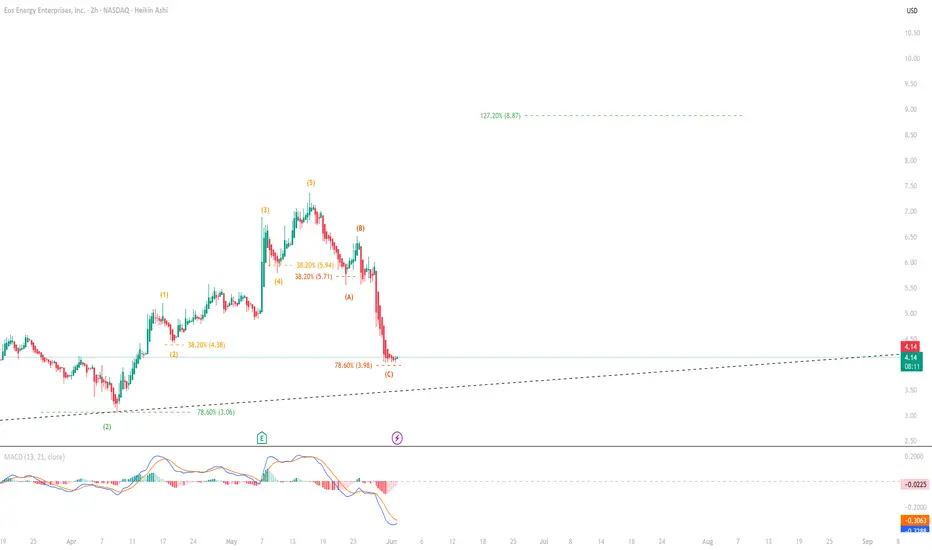
Textbook Correction, Explosive Setup!- The acceleration in growth momentum and the notable increase in orders are highly satisfying. Despite this, there is no indication of overvaluation based on valuation multiples.
- The sector addresses one of the major energy challenges of the future, and the company's position within it is very strong. From a management perspective, no significant issues are expected — in fact, the current crisis presents a potential opportunity.
- Price momentum is very strong, and the stock appears to be completing its A-B-C correction phase in textbook fashion.
- If two consecutive green Heikin Ashi candles appear on the daily chart, the position should be increased. Otherwise, current levels still represent an excellent entry point.
Steps to a Winning Trade Set up | Master Pattern & Indicators 🔑 Your Signature Trade Setup: “Trap-to-Target Confluence”
🔹 Step 1: Identify the Master Pattern
Look for consolidation → manipulation → expansion phases
Confirm price inside a range building up to a breakout
🔹 Step 2: Mark Magnetic Liquidity Zones
Use prior highs/lows, imbalance zones, and volume voids
Highlight areas where price must return to “rebalance”
🔹 Step 3: Indicator Confirmation
Tool Look For Signal Strength
Williams %R -80 to -100 (Oversold trap) or -20 to 0 (Overbought trap) 🔥 Reversal Zone
RSI Bullish/bearish divergence @ liquidity 🧠 Smart Money Trap
Volume Sudden spike near manipulation or retest 💣 Institutional Footprint
🔹 Step 4: Execute Entry
Aggressive: After trap candle closes + divergence confirmed
Conservative: Retest of range/imbalance + confluence
🔹 Risk Management
SL: Just beyond liquidity wick or structural level
TP1: Midpoint of range / imbalance close
TP2: Final opposing liquidity or structure break

Price agreement /MAGNETIC ZONE TO WORK -( Trust the Process) This is where institutional accumulation or distribution happens.
In this chart, I have the blue line, that is the Price agreement.
Price moves sideways in a tight range, establishing areas of price agreement—these are your magnetic zones. ( blue line)
Think of this as the “trap” phase. Liquidity is building on both sides.
These zones are magnetic because:
Volume clusters there.
Most retail traders place orders around these levels.
Price tends to revisit these areas after a move—giving you potential entry on the retest.
🎯 Pro Tip: Mark the midpoint or volume node of the consolidation. It often becomes a key retest or reversion zone later.
Manipulation (Liquidity Grab) on 5/06/25 look at the 4HR chart.
Price breaks out of the range ( 5.28) , usually in the wrong direction 4.89(a false breakout).
This is a liquidity sweep—( 4.89) grabbing stop-losses and triggering emotional entries from uninformed traders.
After the sweep, look for a sharp reversal candle, 05/07/25 at earnings, often with volume spike or order block formation.
🧠 This is where you prepare—not enter yet. Let the market show intent.
Expansion (Real Move + Entry Confirmation)
Once the break of structure (BOS) happens in the opposite direction of the false breakout, that’s your signal.
Your ideal entry is often on:
The retest of the original range high/low (the edge of the magnetic zone),
A breaker block or fair value gap (FVG) just above or below the manipulation candle,
Or a 1HR or 15min order block if you want sniper entries.
🎯 Stop-loss: just outside the sweep level. Take profit: next liquidity pool or opposite side of the range.
🔑 Trusting the Process: Let the Zones Work
The magnetic zones are not just theory. They are psychological footprints of collective human behavior—where traders agree on value. Institutions return to these zones because that’s where the volume is.
Here’s how I trust the process:
Don’t chase the breakout—watch for manipulation.
Trust the reversion—the market often returns to the magnetic zone before the real move.
Wait for confirmation—don’t guess the direction, let the market tell you via BOS or rejection from the zone.
Stick to your system—when the setup aligns across multiple timeframes (1D, 4HR, 1HR), the probabilities are in your favor.
| Step | What to Look For | Tools |
| ---------------- | --------------------- | ------------------------ |
| 1. Consolidation | Range + magnetic zone | Volume Profile, Midpoint |
| 2. Manipulation | Stop hunt / sweep | Wick spikes, OBs |
| 3. Confirmation | BOS + Retest | FVG, Breaker Block, OB |

EOSE Master Pattern Valid. SWEEP made, 1 HR offers entry 🔥 Power Lunch Breakdown – EOSE Master Pattern Entry & Liquidity Zones
🎯 **Ticker**: EOSE
⏱️ **Timeframe Analysis: Daily ➡ 4HR ➡ 1HR
📍 **Focus**: Developing **Master Pattern Entry** & **Liquidity Zones**
📅 **1D (Daily) – Macro Outlook
Structure**: EOSE has been in a bullish phase, forming a range with clear swing highs and lows.
Liquidity Zones:
* Equal highs around =7.28 **buy-side liquidity**
* Equal lows around = 5.61 **sell-side liquidity**
* **Current Action**: Price is inching toward a prior high 6.34 – a likely **liquidity grab setup**.
* **Bias**: Neutral to bullish – waiting for a **stop hunt and reversal confirmation**.
> 🔑 *Watch for a daily wick above support 5.98 and a close back inside the range. That would signal the start of the Master Pattern directional leg.*
---
### ⏳ **4HR – Transitional Clarity**
* **Compression Pattern**: Price is coiling tighter between trendlines, suggesting **engineered breakout** is near.
* **Displacement Zones**:
* Look for a **liquidity sweep** (false breakout) and then a **market structure shift (MSS)** back in the opposite direction.
* **Smart Money Concepts (SMC)**:
* Signs of **internal BOS** (break of structure) already forming.
* **Order blocks** are visible just below liquidity – possible re-entry zones.
> 🔁 *4HR is where we may first see confirmation of institutional intent. Ideal entry is after the sweep + BOS + retest of a breaker or OB.*
---
### 🕐 **1HR – Execution Timing**
* **Entry Window**: Liquidity grab appears imminent or just occurred. Early signs of **momentum reversal**.
* **Volume Profile**:
* Spike in volume = aggressive orders during sweep.
* Look for **low-volume retest** into breaker block for entry.
* **Trade Setup**:
* Entry: On retest of 1HR OB or breaker. 5.57
* Stop Loss: Just outside the swept liquidity. 5.50
* TP: Return to mean, or extend to FVG targets / opposite liquidity pool.
> 🎯 *This is the sniper entry zone. Manage risk tightly. Your edge is in precision and narrative alignment across all timeframes.*
---
### 📈 Summary (Trade Thesis)
* **Daily** shows **liquidity draw**.
* **4HR** gives us the **break of structure** and institutional footprint.
* **1HR** offers **precise entry** after the manipulation leg completes.
> 🧠 **If price breaks structure without a sweep**, the master pattern is invalid. Wait for confirmation.

Technical Breakdown: EOSE 1D Chart – Master Pattern Entry & LiquUpon observing the 1-day chart for EOSE, we can identify a master pattern formation—a repeating structural blueprint that typically precedes impulsive moves in the market. This pattern often comprises a consolidation phase, a false breakout (liquidity grab), and a directional expansion.
🔍 Key Observations:
1. Consolidation Range Identified
• Price action over the last several weeks shows clear range-bound movement, where price has been coiling between identifiable support and resistance levels. This builds up liquidity on both sides of the range.
2. Liquidity Engineering
• The market has created visible swing highs and lows which are prime targets for stop hunts. These levels attract retail orders, and institutions tend to use them to execute larger orders.
• Currently, price is gravitating toward one of these key liquidity zones—suggesting that a sweep or manipulation event may occur before the next significant move.
3. Master Pattern Entry
• The entry signal is triggered once the market sweeps liquidity (either above or below the range) and then breaks structure in the opposite direction with momentum.
• On the 1D chart, we can see a deviation from the high (or low) of the range followed by an impulsive candle that closes back inside. This is typically the entry confirmation for traders following institutional order flow logic.
4. Volume Confirmation
• Volume analysis also supports the narrative: there’s an uptick in volume during the sweep, indicating institutional interest, followed by absorption and reversal.
🧠 Summary:
The current market behavior for EOSE reflects the hallmarks of a master pattern setup. The price is being drawn toward liquidity pools, likely to trigger stop-losses and capture inefficiencies before the next expansion phase. Traders should monitor the 1D chart for a confirmed sweep and break of structure, which typically defines the optimal entry point for directional positioning.

Charts tell a story- EOSE Bullish Uptrend I believe this is so cool. When you see the pattern developing and the money flow and traders agreements in the chart.
In this video I identified the set up and calculated trade entry and exit using technical analysis.
I look at volume ( energy ) and candle wicks ( the story) . Then the trend. Earnings and news.
Before entering a trade map out and have a trading plan, I love tradingview for the tools and opportunity we have to share.

Eos Energy (EOSE) Clean Tech Growth Supports BreakoutEos Energy Enterprises, Inc. (EOSE) develops and manufactures zinc-based energy storage systems designed to support clean energy transition. Their battery technology is aimed at long-duration storage, which helps utilities and large-scale energy users store renewable power more efficiently. As demand for grid-scale energy storage grows, Eos is positioned as a key player in enabling more stable, sustainable power systems.
The chart recently showed a confirmation bar with rising volume, and the stock pushed above the .236 Fibonacci level—placing it into the momentum zone. This technical setup signals growing interest from buyers. Traders may consider using the .236 level as a trailing stop reference with the Fibonacci snap tool to stay with the trend while managing risk.

$EOSE bears will be baggotsKey Stats:
• Market Capitalization: $1.3B
• Next Earnings Date: Feb 21, 2025
Technical Indicators:
1. Momentum Surge: EOSE has experienced a significant upward momentum, with the stock price nearly doubling from its 52-week high of $3.30 in October 2024 to $6.02 in January 2025. 
2. Volume Increase: The stock has seen increased trading volume, indicating growing investor interest and potential for continued price appreciation.
3. Moving Averages Alignment: The 50-day moving average has crossed above the 200-day moving average, forming a bullish “Golden Cross” pattern, suggesting a sustained uptrend.
Fundamental Indicators:
1. Strategic Investments: Eos Energy completed milestones with Cerberus Capital Management, unlocking an additional $30 million, strengthening its financial position. 
2. Revenue Growth Projections: The company anticipates 2024 revenue between $60 million and $90 million, aiming for positive operating cash flow by 2025, indicating robust growth prospects. 
3. Industry Recognition: Recognized as a tier-one energy storage supplier by Bloomberg New Energy Finance, Eos Energy is positioned favorably within the industry. 
Potential Paths to Profit:
1. Buy Shares: Purchasing EOSE shares at the current price of $6.02 and holding until the target price.
2. Buy LEAP Options: With OTM strike price near the target price and an expiration date beyond February 2025 to leverage potential gains.
Disclaimer: We are not a brokerage or investment firm. We do not offer financial advice or investment advice and/or signals. This is not certified financial education. We offer access to the daily thought process of an individual and his experiences. We do not offer refunds. All sales are final.
Please LIKE, FOLLOW, SHARE, and COMMENT if you enjoy this idea! Also, share your ideas and charts in the comments section below! This is the best way to keep this signal relevant, keep the content free, and allow the idea to reach as many people as possible.

Don't FOMO into $EOSE, Be a LION and wait for your moment! NASDAQ:EOSE 🔋🪫
Another BANGER from Charturday!
I've adjusted the CupnHandle Breakout as it's now right at the Measured move of the Bull Flag breakout while also being at prior wick high.
IMO this is not a good entry and would be considered chasing. I'm going to wait for the Wr% to peel off the Williams CB red barrier and look for support to form and enter then.
If it doesn't happen and continues to run it's OKAY! You can't have endless plates or delicious HAM or PIE during the Holidays! The same goes for the stock market friends!
Not financial advice.

EOSE Breakout Eminent Wave Analysis and Current Setup
The chart reflects a potential Elliott Wave 5 bullish count: Wave (1): The initial impulse move upward from the recent bottom, Wave (2): A corrective pullback that retraced a portion of Wave (1), forming a higher low, Wave (3): Anticipated continuation of a strong upward move, aiming for Fibonacci extensions around $6.38, $7.06, and $8.16, Wave (4): A projected minor corrective pullback, Wave (5): A final upward push towards the 161.80% Fib Extension at $8.94.
The green trajectory outlines this bullish wave setup.
Key Support Levels: Immediate Support: $2.39 (50% retracement), Interim Support: $1.71 (23.6% retracement), Major Support: $0.61 (absolute low).
Key Resistance Levels: First Resistance: $4.28 (78.6% retracement), Wave Resistance: $6.38 to $8.16 (Fibonacci extensions, critical for Wave 3 completion), Major Resistance: $9.94 (200% Fib extension).
RSI and Momentum: RSI: Trending upward at 71.58, suggesting the stock is nearing overbought conditions. However, strong upward momentum could sustain RSI in the 70+ range for longer during Wave 3, MACD: Bullish crossover with strong momentum supporting the uptrend.
Volume Trends: Noticeable volume spikes coincide with upward price movement, confirming institutional interest or heavy buying pressure during breakout moves.
Market Sentiment: The presence of Fibonacci resistance clusters around $6.38 to $8.94 indicates strong confluence and potential selling zones. Traders might take profits near these levels.
Trading Strategy: Current Positioning: A tight risk setup is indicated with a $0.50 stop-loss, providing a favorable risk-reward ratio.
Entry Point: Around $3.89, where price currently trades.
Profit Targets: Short-term: $4.28 (78.6% retracement), Intermediate-term: $6.38 (123.6% Fib extension), Long-term: $8.94 (161.8% Fib extension).
Stop-Loss Placement: Below immediate support near $2.39.
Options Play: Consider selling cash-secured puts at $2.50 strike or targeting covered calls near $6-$7 resistance to capitalize on premium.
Conclusion: EOSE is exhibiting a textbook Elliott Wave bullish structure supported by Fibonacci extensions and volume confirmation. The setup offers significant upside potential with clear resistance targets while maintaining a manageable risk profile. Traders should monitor RSI and volume for momentum validation during Wave 3’s progression.

Roadmap for EOSEBlue solid lines are downtrends, green dotted lines are uptrends. Both the uptrend and downtrend lines are established from equilibrium points, (not highs and lows).

Target 1.80Following weekly chart.
Got long signal from my indicator.
TP1 1.8
TP2 - 5.67
TP3 - 8.79
SL - 0.61

EOSE Long Bullish ButterflyEOSE has formed a bullish butterfly on the daily. Potential opportunity for trend reversal and good entry to go long

$EOSEThis is a battered down stonk with some active online promoters. This is a high risk trade. I like the broken down trend from the past two major highs. I have put on many positions like this profitably. Size this long as though it could donut, cause... ya never know.

EOSE Long Wyckoff accumulation On the EOSE weekly chart it appears we have Wyckoff accumulation playing out over the course of the year

Great potentialYou can triple your money with this trade, great risk reward. Price is trading on a strong demand zone. It may take several weeks, that's fine for me I'm not going anywhere. Take profits on the way up, and use limit orders, this one is very volatile.

Very bullish triple bottom , first target $2Looks like a solid triple bottom to me and we should rip all the way to $2, pull back and go even higher. This right here looks like a solid mid - long term swing trade with a potential long term target at around $7-$8.

Cheap stockJust bought uncovered puts exp 10/27 strike 2.5. I expect a bounce of the trendline and keep the puts premium when expire worthless. However I don't mind if they get assigned. I would get stocks very cheap price and then I would sell covered calls. I chose this stock because its options are sell at a very attractive price.

EOSE Short Squeeze Potential !EOSE went down this month from $5.70 to $1.24, the CEO accessing a short sellers attack on the stock.
Now considering the pre-market volume, and the fact that the stock is already up 13%, I believe it has a short squeeze potential to the next resistances of $3.30, then $4.90.
Eos Energy Enterprises designs, manufactures, and markets zinc-based energy storage solutions for utility, commercial and industrial, and microgrid markets in the United States. T
he company's flagship product is the Eos Znyth DC system, a battery that can be used as an alternative to Li-ion batteries.
Looking forward to read your opinion about it.
