Esperion Therapeutics Analyst Ratings In February 2020, both Nexletol and Nexlizet were approved as oral treatments to lower LDL-C. Bempedoic acid remains in clinical trials of its efficacy in risk reduction for cardiovascular disease.
Esperion shares peaked last February, after the FDA approvals, but since then, the stock has declined. Shares are down 65% since their peak. (tipranks.com)
Analyst ratings:
11/10/2020 Credit Suisse Group $45.00
10/15/2020 Bank of America $52.00
9/29/2020 JPMorgan Chase & Co. $35.00
8/11/2020 Needham & Company LLC $158.00
8/10/2020 Stifel Nicolaus $75.00
Today`s price: usd27.71
Please leave me a message if you want to test the buy and sell indicators that i am using.
ESPR trade ideas

ESPR, enters Uptrend as Momentum ascends above 0 level on Nov 16This indicator may be signaling that ESPR's price has momentum to move higher, since its current price exceeds the price logged 14 days ago. Traders may consider buying the stock or exploring call options. Tickeron's A.I.dvisor backtested 94 similar cases where ESPR's Momentum Indicator exceeded 0, and 81 of them led to a successful outcome. Odds of Success: 86%. Current price $30.06 is below $33.39 the lowest support line found by Tickeron A.I. Throughout the month of 10/15/20 - 11/16/20, the price experienced a -13% Downtrend, while the week of 11/09/20 - 11/16/20 shows a +8% Uptrend.
Bullish Trend Analysis
The RSI Oscillator points to a transition from a downward trend to an upward trend -- in cases where ESPR's RSI Oscillator exited the oversold zone, 21 of 27 resulted in an increase in price. Tickeron's analysis proposes that the odds of a continued upward trend are 78%.
The Moving Average Convergence Divergence (MACD) for ESPR just turned positive on November 12, 2020. Looking at past instances where ESPR's MACD turned positive, the stock continued to rise, Tickeron A.I. shows that in 32 of 39 cases over the following month. The odds of a continued upward trend are 82%.
Following a +8.09% 3-day Advance, the price is estimated to grow further. Considering data from situations where ESPR advanced for three days, in 262 of 308 cases, the price rose further within the following month. The odds of a continued upward trend are 85%.
ESPR may jump back above the lower band and head toward the middle band. Traders may consider buying the stock or exploring call options.


ESPR enters Uptrend as Momentum ascends above 0 level (09/29/20)This indicator may be signaling that ESPR's price has momentum to move higher, since its current price exceeds the price logged 14 days ago. Traders may consider buying the stock or exploring call options. Tickeron A.I.dvisor backtested 96 similar cases where ESPR's Momentum Indicator exceeded 0, and 84 of them led to a successful outcome. Odds of Success: 88%. urrent price $37.50 crossed the support line at $36.87 and is trading between $37.81 support and $36.87 support lines. Throughout the month of 08/27/20 - 09/29/20, the price experienced a +10% Uptrend. During the week of 09/22/20 - 09/29/20, the stock enjoyed a +0.13% Uptrend growth.
Bullish Trend Analysis
The Stochastic Indicator suggests the stock price trend may be in a reversal from a downward trend to an upward trend. Tickeron A.I. detected that in 49 of 57 cases where ESPR's Stochastic Oscillator exited the oversold zone resulted in an increase in price. Tickeron's analysis proposes that the odds of a continued upward trend are 81%.
The Momentum Indicator moved above the 0 level on September 29, 2020. You may want to consider a long position or call options on ESPR as a result. In 84 of 96 past instances where the momentum indicator moved above 0, the stock continued to climb. The odds of a continued upward trend are 88%.
The Moving Average Convergence Divergence (MACD) for ESPR just turned positive on September 25, 2020. Looking at past instances where ESPR's MACD turned positive, the stock continued to rise, Tickeron A.I. detected that in 33 of 39 cases over the following month. The odds of a continued upward trend are 85%.
ESPR moved above its 50-day Moving Average on September 29, 2020 date and that indicates a change from a downward trend to an upward trend.
The 10-day Moving Average for ESPR crossed bullishly above the 50-day moving average on September 28, 2020. This indicates that the trend has shifted higher and could be considered a buy signal. Tickeron A.I. detected that in 14 of 17 past instances when the 10-day crossed above the 50-day, the stock continued to move higher over the following month. The odds of a continued upward trend are 82%.
Following a +6.26% 3-day Advance, the price is estimated to grow further. Considering data from situations where ESPR advanced for three days, in 267 of 310 cases, the price rose further within the following month. The odds of a continued upward trend are 86%.
ESPR may jump back above the lower band and head toward the middle band. Traders may consider buying the stock or exploring call options.
The Aroon Indicator entered an Uptrend today. Tickeron A.I. detected that in 174 of 212 cases where ESPR Aroon's Indicator entered an Uptrend, the price rose further within the following month. The odds of a continued Uptrend are 82%.

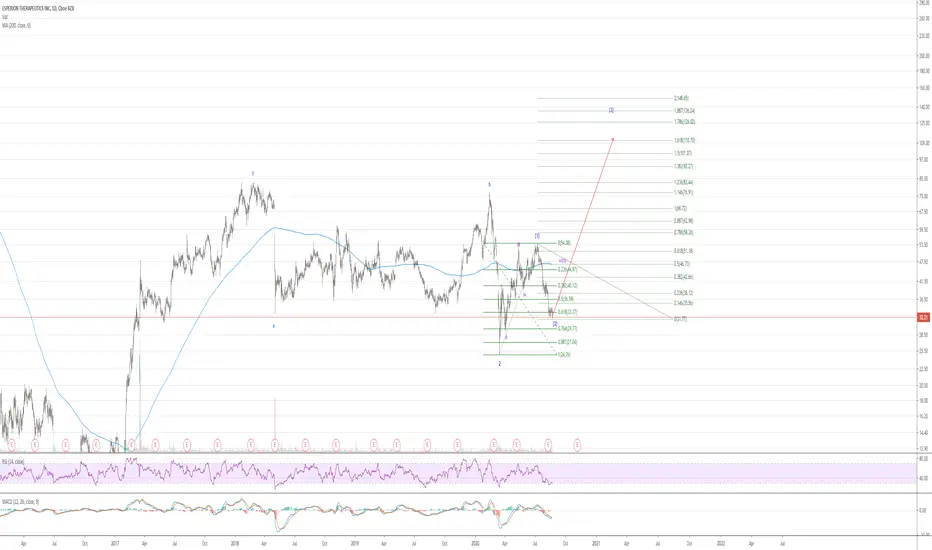
ESPR: Completed a 61.8 retracement for the wave 2 of 3 with the Sweet 3 of 3 next. Target $110 which is almost 4 times the current price.
Esperion Therapeutics Inc on breakout watch Esperion Therapeutics, Inc. engages in the development and commercialization of oral therapies for the treatment of patients with elevated low-density lipoprotein cholesterol. It offers NEXLETOL (bempedoic acid) tablets, and NEXLIZET (bempedoic acid and ezetimibe) tablets. The company was founded by Roger S. Newton, Hans Ageland, Jan O. Johansson, Anders Paul Wiklund, Michael E. Pape, David I. Scheer and Charles L. Bisgaier in May 1998 and is headquartered in Ann Arbor, MI.

ESPR expect further downsideI just started playing with FDA approvals using my pendulum. I don't see anything good coming out of this news event other than a bounce to sell into.
Symmetry support is $57.15 held once. Will it twice??
If it doesn't hold this 786 fib (53.99), the door is open to $40.

Esperion Announces FDA Approval of the NEXLIZET™ (bempedoic acidESPR: Esperion Therapeutics, Inc.
2020-02-26 17:30:10
Esperion Announces FDA Approval of the NEXLIZET™ (bempedoic acid and ezetimibe) Tablet, an Oral, Once-Daily, Non-Statin LDL-Cholesterol Lowering Medicine

Esperion Announces FDA Approval of NEXLETOL™ (bempedoic acid) TaESPR: Esperion Therapeutics, Inc.
2020-02-21 16:38:10
Esperion Announces FDA Approval of NEXLETOL™ (bempedoic acid) Tablet, an Oral, Once-Daily, Non-Statin LDL-Cholesterol Lowering Medicine

ESPR FDA burn it down?BE CAREFUL!!
I'm getting bad vibes on the news for tomorrow in this one. This is based on my dowsing work and it suggests a drop of 38%. That would rock it down to about $42.50
FYI I don't know anything about the fundamentals or background on this pending approval, and I really don't know anything about the company, nor do I care.
I'm not super confident yet in estimating percent moves, and this is only my second FDA prediction, so we'll see.

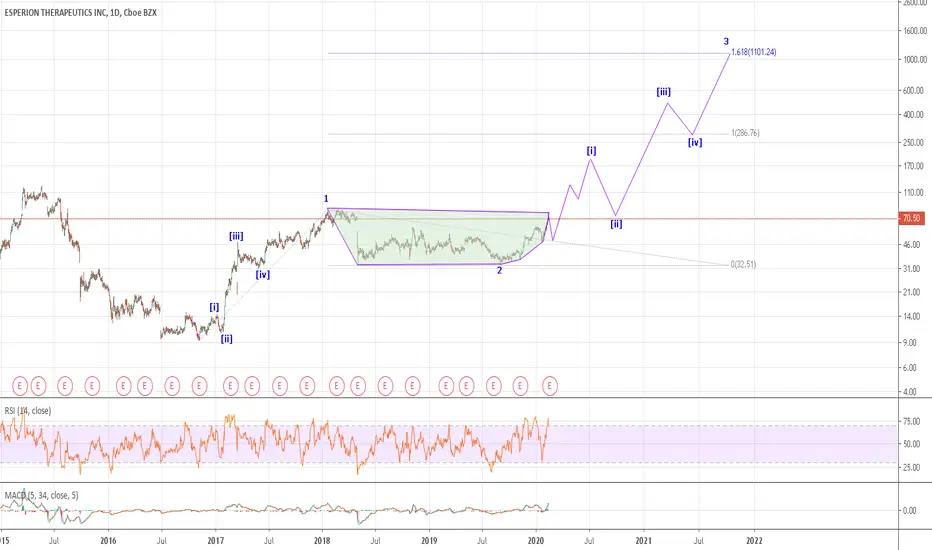
ESPR: Just started on wave 3. Saucer and handle pattern might retrace for an entry position at base of handle.
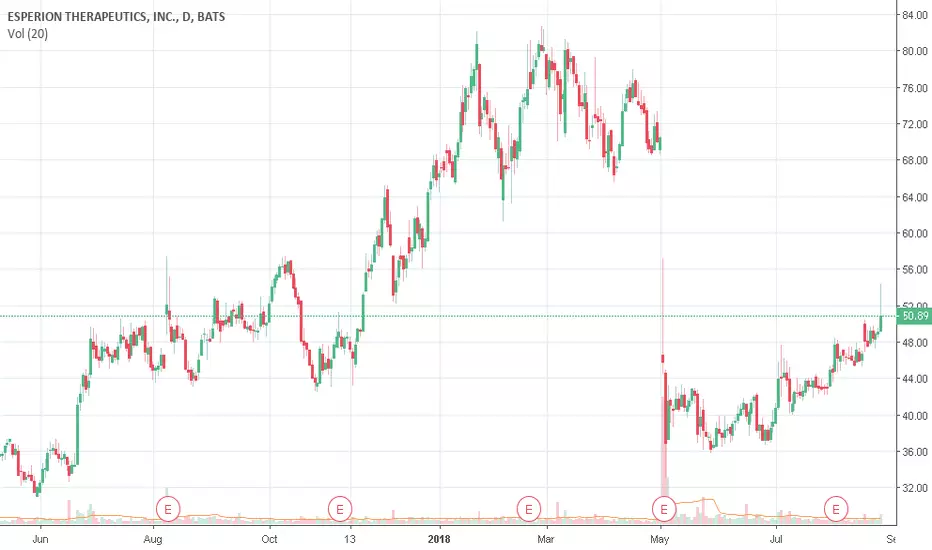
$ESPR Nice Cup w/HandleI took this position yesterday when it broke back above the handle line on this near textbook Cup with Handle pattern (it's a little deep, but I still like it)... My stop is $46, Entry $52.55. My first target is the last high of $60 then on to it's all time high around $80... Ideas, Not investing / trading advice.

ESPR TA ShortNot Financial Advice:
Biggest thing to watch is the small squeeze taking place that should send it further down. Time will tell if they announce any breakthroughs.

$ESPR Bio - Future catalyst with neutral viewNASDAQ:ESPR
Future Catalyst:
October 2018 10/31/2018
Phase 3 data due October, 2018.
Market cap: 1.2B. Float: 24.25M
Company Notes - Negative income, 57 employees, 0 debt, 14% Inst owned, mixed analysis opinion.
50/50 split bulls/bears- I'm suspecting this will continue to bounce a little of its multiple bottom and have some natural longs take this stock up into the catalyst BUT with their history in poor earnings results I expect this to sell off back to the recent support and depending on the results of P3 could be looked at negatively buy investors.

ESPR Announces Positive Top-Line Results from Pivotal Phase 3ESPR: Esperion
2018-08-27 07:00:00
Esperion Announces Positive Top-Line Results from Pivotal Phase 3 Bempedoic Acid / Ezetimibe Combination Pill Study
ESPR BUY?ESPR is oversold according To RSi. Looks like it has gapped down to a support area. Billion Dollar company- dont think it will be going broke anytime soon. More than likely they have other products going on. And supposedly the news isnt as bad as it seems. there is a law suit pending which could drive the stock down more. So keep on your watch list.

ESPR buy next weekStock had buy signals generated in 2nd half of December:
Stochastics Momentum Index on 19DEC17
Stochastic RSI on 22DEC17
volume-price on 27DEC17
Waiting for price to hit my lower trend line, maybe next week

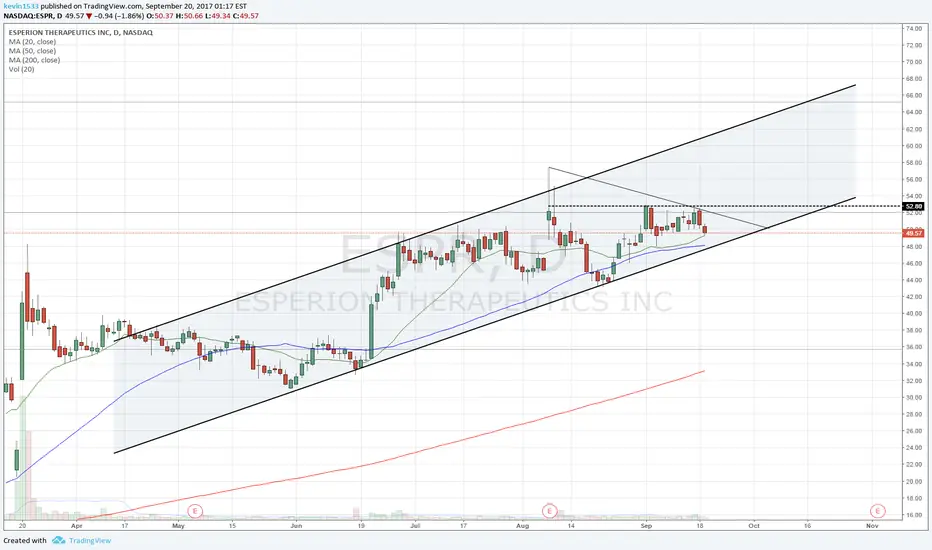
ESPR: 2nd Chance To Go Long ?ESPR rallied 85% from its last consolidation to its near term high at $57.38.
Prices have since been in consolidation mode in the form of a expanded FLAT.
The consolidation appears to be completed.
A successful break to the upside could bring prices to a range between $82.24 (Fib Exp 1.5x) to $85.36 (Fib Exp 1.618x)
Break of Critical Support could imply any of the following possibilities:
(1) A much larger scale FLAT is forming where prices could likely find support between the range of $20 and $30.
(2) Prices are in an A-B-C correction and will break its Nov 2016 low of $9.40
Till then, the operative wave structure supports the bullish bias to break upwards from current price.

$ESPR BUY AlertTIME to BUY On support.
We believe this stock will spike in short time.
BUY and HOLD
MPP for Profit

ESPR: Breaking Out Of Consolidation ?ESPR appears to have completed a textbook ABC correction.
Look out for a upside target of recent highs of $48.21 and more.
SL: Recent lows at $30.95

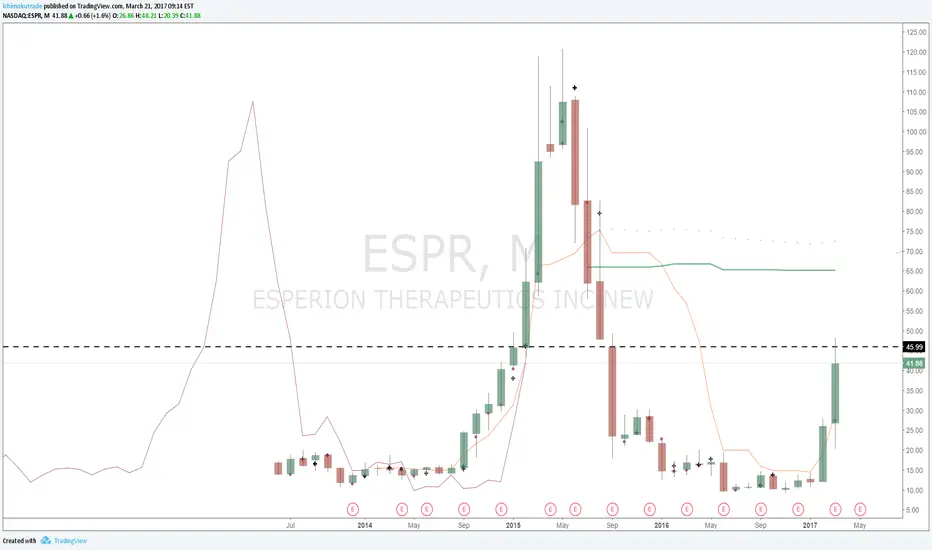
$ESPR hits major resistance with unusual put volume 2017-04-21 $ESPR hits major resistance with unusual put volume 2017-04-21 40.00 P BOT @ 3.20 #options #option #ichimoku #stocks #stock #stocktweets
ESPR shortI trade charts not fundamentals, this thing had ugly earnings and a Trump rumor of approval of cholesterol-lowering treatment drug make this run 300% in past 2 months. 30.5s is the big resistance, RSI peaking 80 3 times, this thing will correct soon.
short 30.5, stop 31.5, don't marry it, it was breaking higher 2 times already, this thing was holding 9 EMA really well. so our first take profit will be there 9 EMA, or 26s whatever occurs first, and then 21.75s. is really a good r/r opportunity.
