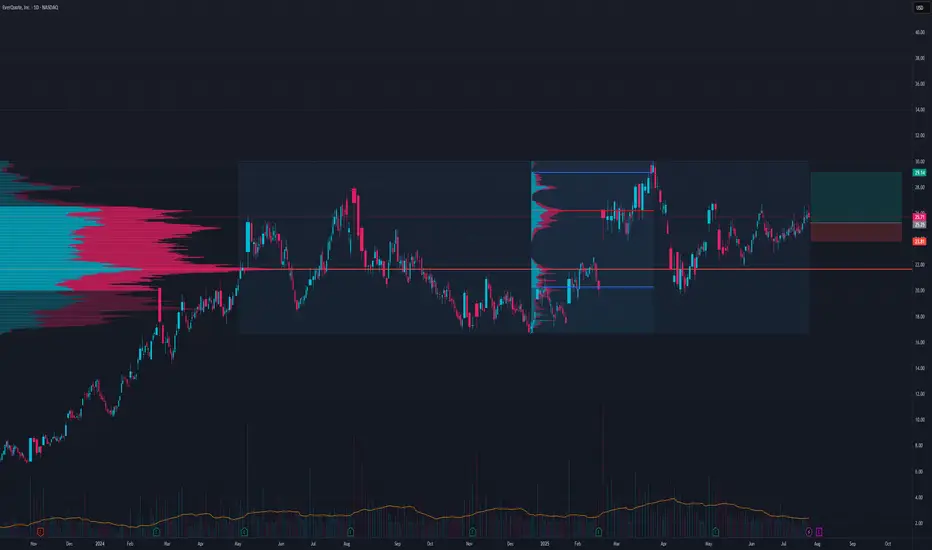
EVER LongIf we get a pull back this is a pretty good risk reward, but it will probably break this range and head towards 33$
SL at 23.74
Next report date
—
Report period
—
EPS estimate
—
Revenue estimate
—
1.08 USD
32.17 M USD
500.19 M USD
26.61 M
About EverQuote, Inc.
Sector
Industry
CEO
Jayme Mendal
Website
Headquarters
Cambridge
Founded
2008
FIGI
BBG00F17NDH7
EverQuote, Inc. operates as an online insurance marketplace connecting consumers with insurance providers. It offers car, home and life insurance. The firm’s data and technology platform matches and connects consumers seeking to purchase insurance with relevant options from its broad direct network of insurance providers. The company was founded by Seth N. Birnbaum, David B. Blundin, and Tomas Revesz in August 1, 2008 and is headquartered in Cambridge, MA.
Related stocks
EVER/USD – 30-Min Long Trade Setup !📌🚀
🔹 Asset: EVER (EverQuote, Inc.)
🔹 Timeframe: 30-Min Chart
🔹 Setup Type: Bullish Breakout Trade
📌 Trade Plan (Long Position)
✅ Entry Zone: Above $26.89 (Breakout Confirmation)
✅ Stop-Loss (SL): Below $26.09 (Invalidation Level)
🎯 Take Profit Targets:
📌 TP1: $27.85 (First Resistance Level)
📌 TP2:

EVER TO HIT 28.12 by 28 Feb 25EVER has displayed eye-catching stability over the last three months forming what looks to be a meaningful base in the last two weeks of October 24. The further push out of trend Friday could be a clue to the coming week.
There are clearly significant bag holders that may create some very short-te

EverQuote: Hidden Divergence Partial Decline Near Bat PCZThere is Hidden Bullish Divergence as we are Potentially putting in a Higher Low Partial Decline within a Right-Angled and Descending Broadening Formation just below the PCZ of a Bullish Bat and if we breakout then the move should take us up at least about 200% from the current price level.

EVER: Daily VCPSetup: PowerPlay
VCP: 3W 21/4 3T
RS: 97
The posted chart contains a VCP (volatility contraction pattern). The first label "W" stands for weekly and shows the duration of the entire consolidation. In the middle label, the percentage of contractions is indicated (for example, "15/4"), with 15 repres

$EVER Is EverQuote About to quote higher prices?Traders, Like majority of the stocks in this market cap category there is an M pattern which has been completed. This means that we now have a bullish bias on this stock. A trend line has been broken and retested successfully which means that this stock price is ready to go higher. As the overall ma


See all ideas
Summarizing what the indicators are suggesting.
Neutral
SellBuy
Strong sellStrong buy
Strong sellSellNeutralBuyStrong buy
Neutral
SellBuy
Strong sellStrong buy
Strong sellSellNeutralBuyStrong buy
Neutral
SellBuy
Strong sellStrong buy
Strong sellSellNeutralBuyStrong buy
An aggregate view of professional's ratings.
Neutral
SellBuy
Strong sellStrong buy
Strong sellSellNeutralBuyStrong buy
Neutral
SellBuy
Strong sellStrong buy
Strong sellSellNeutralBuyStrong buy
Neutral
SellBuy
Strong sellStrong buy
Strong sellSellNeutralBuyStrong buy
Displays a symbol's price movements over previous years to identify recurring trends.
Frequently Asked Questions
The current price of EVER is 25.71 USD — it has decreased by −0.60% in the past 24 hours. Watch EverQuote, Inc. stock price performance more closely on the chart.
Depending on the exchange, the stock ticker may vary. For instance, on NASDAQ exchange EverQuote, Inc. stocks are traded under the ticker EVER.
EVER stock has risen by 3.59% compared to the previous week, the month change is a 6.33% rise, over the last year EverQuote, Inc. has showed a 3.75% increase.
We've gathered analysts' opinions on EverQuote, Inc. future price: according to them, EVER price has a max estimate of 38.00 USD and a min estimate of 30.00 USD. Watch EVER chart and read a more detailed EverQuote, Inc. stock forecast: see what analysts think of EverQuote, Inc. and suggest that you do with its stocks.
EVER reached its all-time high on Jul 13, 2020 with the price of 63.44 USD, and its all-time low was 4.05 USD and was reached on Dec 28, 2018. View more price dynamics on EVER chart.
See other stocks reaching their highest and lowest prices.
See other stocks reaching their highest and lowest prices.
EVER stock is 3.99% volatile and has beta coefficient of 1.17. Track EverQuote, Inc. stock price on the chart and check out the list of the most volatile stocks — is EverQuote, Inc. there?
Today EverQuote, Inc. has the market capitalization of 929.59 M, it has decreased by −3.35% over the last week.
Yes, you can track EverQuote, Inc. financials in yearly and quarterly reports right on TradingView.
EverQuote, Inc. is going to release the next earnings report on Aug 4, 2025. Keep track of upcoming events with our Earnings Calendar.
EVER earnings for the last quarter are 0.42 USD per share, whereas the estimation was 0.33 USD resulting in a 27.80% surprise. The estimated earnings for the next quarter are 0.35 USD per share. See more details about EverQuote, Inc. earnings.
EverQuote, Inc. revenue for the last quarter amounts to 166.63 M USD, despite the estimated figure of 157.97 M USD. In the next quarter, revenue is expected to reach 157.22 M USD.
EVER net income for the last quarter is 7.99 M USD, while the quarter before that showed 12.31 M USD of net income which accounts for −35.07% change. Track more EverQuote, Inc. financial stats to get the full picture.
No, EVER doesn't pay any dividends to its shareholders. But don't worry, we've prepared a list of high-dividend stocks for you.
As of Jul 27, 2025, the company has 331 employees. See our rating of the largest employees — is EverQuote, Inc. on this list?
EBITDA measures a company's operating performance, its growth signifies an improvement in the efficiency of a company. EverQuote, Inc. EBITDA is 51.51 M USD, and current EBITDA margin is 7.48%. See more stats in EverQuote, Inc. financial statements.
Like other stocks, EVER shares are traded on stock exchanges, e.g. Nasdaq, Nyse, Euronext, and the easiest way to buy them is through an online stock broker. To do this, you need to open an account and follow a broker's procedures, then start trading. You can trade EverQuote, Inc. stock right from TradingView charts — choose your broker and connect to your account.
Investing in stocks requires a comprehensive research: you should carefully study all the available data, e.g. company's financials, related news, and its technical analysis. So EverQuote, Inc. technincal analysis shows the buy rating today, and its 1 week rating is buy. Since market conditions are prone to changes, it's worth looking a bit further into the future — according to the 1 month rating EverQuote, Inc. stock shows the strong buy signal. See more of EverQuote, Inc. technicals for a more comprehensive analysis.
If you're still not sure, try looking for inspiration in our curated watchlists.
If you're still not sure, try looking for inspiration in our curated watchlists.