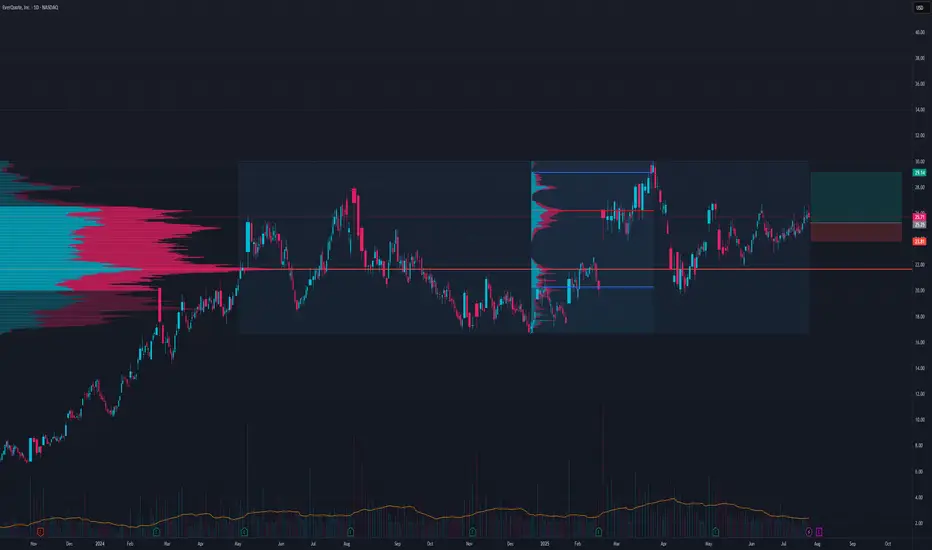
EVER LongIf we get a pull back this is a pretty good risk reward, but it will probably break this range and head towards 33$
SL at 23.74
EVER trade ideas
EVER/USD – 30-Min Long Trade Setup !📌🚀
🔹 Asset: EVER (EverQuote, Inc.)
🔹 Timeframe: 30-Min Chart
🔹 Setup Type: Bullish Breakout Trade
📌 Trade Plan (Long Position)
✅ Entry Zone: Above $26.89 (Breakout Confirmation)
✅ Stop-Loss (SL): Below $26.09 (Invalidation Level)
🎯 Take Profit Targets:
📌 TP1: $27.85 (First Resistance Level)
📌 TP2: $28.81 (Extended Bullish Move)
📊 Risk-Reward Ratio Calculation
📉 Risk (SL Distance): $26.89 - $26.09 = $0.80 risk per share
📈 Reward to TP1: $27.85 - $26.89 = $0.96 (1:1.2 R/R)
📈 Reward to TP2: $28.81 - $26.89 = $1.92 (1:2.4 R/R)
🔍 Technical Analysis & Strategy
📌 Ascending Triangle Breakout: Price has formed an ascending triangle, a bullish continuation pattern.
📌 Bullish Momentum Building: A breakout above $26.89 with strong volume confirms the move.
📌 Volume Confirmation Needed: Ensure high buying volume when price breaks $26.89 to confirm upward momentum.
📌 Momentum Shift Expected: If the price holds above $26.89, a move toward $27.85 and then $28.81 is likely.
📊 Key Support & Resistance Levels
🟢 $26.09 – Stop-Loss / Support Level
🟡 $26.89 – Breakout Level / Long Entry
🔴 $27.85 – First Resistance / TP1
🔴 $28.81 – Final Target / TP2
📉 Trade Execution & Risk Management
📊 Volume Confirmation: Ensure high buying volume above $26.89 before entering.
📉 Trailing Stop Strategy: Move SL to entry ($26.89) after TP1 ($27.85) is hit.
💰 Partial Profit Booking Strategy:
✔ Take 50% profits at $27.85, let the rest run toward $28.81.
✔ Adjust Stop-Loss to Break-even ($26.89) after TP1 is reached.
⚠️ Fake Breakout Risk
❌ If the price fails to hold above $26.89 and drops back, exit early to avoid losses.
❌ Wait for a strong bullish candle close above $26.89 before entering aggressively.
🚀 Final Thoughts
✔ Bullish Setup – Breaking above $26.89 could lead to higher targets.
✔ Momentum Shift Possible – Watch for volume confirmation.
✔ Favorable Risk-Reward Ratio – 1:1.2 to TP1, 1:2.4 to TP2.
💡 Stick to the plan, manage risk, and trade smart! 🚀📈
🔗 #StockTrading #EVER #LongTrade #TechnicalAnalysis #MomentumStocks #ProfittoPath #TradingView #StockMarket #SwingTrading #RiskManagement #ChartAnalysis 📈🔥

EVER TO HIT 28.12 by 28 Feb 25EVER has displayed eye-catching stability over the last three months forming what looks to be a meaningful base in the last two weeks of October 24. The further push out of trend Friday could be a clue to the coming week.
There are clearly significant bag holders that may create some very short-term headwinds. However, I'm confident in this position, and given its earnings due out on 24 Feb, it should make a bullish move north to 28.12 by 28 Feb 25.
I plan to trade this in 10% of My Portfolio given the above analysis and secure more profit should it breach 28.12 or hopefully 30. At that point, renewed confidence in the stock could see it go higher. I will continue to chase it to previous levels possibly in the 40s or 50s by the end of the year. BUY now or on any minor pullback if not already started.
This is not financial advice, merely a reflection of my thoughts and analysis.
Good luck to all. Protect your gains. BUY now or on any minor pullback

EverQuote: Hidden Divergence Partial Decline Near Bat PCZThere is Hidden Bullish Divergence as we are Potentially putting in a Higher Low Partial Decline within a Right-Angled and Descending Broadening Formation just below the PCZ of a Bullish Bat and if we breakout then the move should take us up at least about 200% from the current price level.

EVER: Daily VCPSetup: PowerPlay
VCP: 3W 21/4 3T
RS: 97
The posted chart contains a VCP (volatility contraction pattern). The first label "W" stands for weekly and shows the duration of the entire consolidation. In the middle label, the percentage of contractions is indicated (for example, "15/4"), with 15 representing the -15% depth of the base and 4 representing -4% of the last contraction. The last part "T" represents the number of contractions. The light blue lines in the chart correspond to the contractions. A more detailed description can be found in Mark Minervini's books.
RS stands for relative strength and measures the strength of the stock compared to the overall market. The value range is 1-99 with 99 being the highest value. The rank was generated by fyntrade.

$EVER Is EverQuote About to quote higher prices?Traders, Like majority of the stocks in this market cap category there is an M pattern which has been completed. This means that we now have a bullish bias on this stock. A trend line has been broken and retested successfully which means that this stock price is ready to go higher. As the overall market is taking a little recovery (upside correction so far), this can be a good opportunity however I would rate this as a speculative buy. The set up looks good from the technical analysis perspective.


Long EVER if BO at 53.91As illustrated. See if it can beat the resistances after its competitor SLQT IPO.

Bull FlagGrowing trend on the daily chart and Downtrend on the hourly chart.
Visible flag shape visible.
If the upper boundary of the downtrend is broken and volumes increase, you can take long.
Take Profit1 - 50.09 +1.86%
Take Profit2 - 51.69 +5.12%
Take Profit3 - 53.17 +8.16%
Stop Loss - 47.98 - 2.69%

EVERQUOTE INC TICKER (EVER) SHORT SET UPSHORT/SELL (EVER) STOCK
ENTRY 1 $36.11
ENTRY 2 $37.21
SL $39.31
TP.1 $31.21
TP.2 $28.11
TP.3 $25.31


Wait to test the demand zone and buy with EVERMy strategy is to combine several techniques at once:
+ Price channel and trend line: help me identify the direction of the price,
+ Supply - demand: help me identify the reversal position,
+ Elliott wave: help me determine the cycle of price,
+ Candlestick patterns and price action: Help me enter the order at the right time.
............


