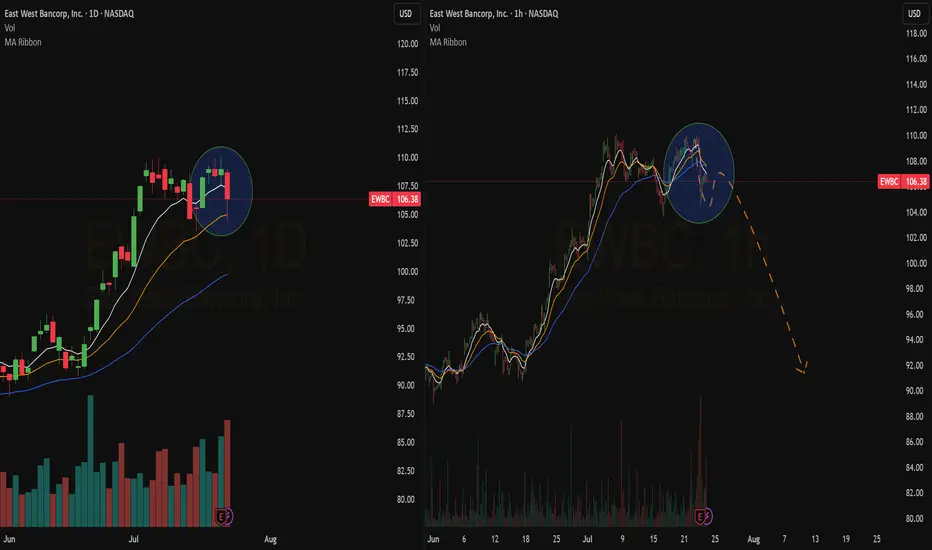
Quick View : $EWBCShort setup here
Bearish crossover on the hourly chart with double top at $110.
The price already crossed the level and made its FAST pullback.
I expect a sharp action here.
Bearish ATR Alert ready.
Reaty To Catch It
EWBC trade ideas
EAST WEST BANCORP Stock Chart Fibonacci Analysis 051123Trading Idea
1) Find a FIBO slingshot
2) Check FIBO 61.80% level
3) Entry Point > 44/61.80%

EWBC - Next Shoe/Bank to Drop.Controlled Demolition in ProgressGood Friday but not for EWBC and $KRE components.
Controlled Demolition in Progress.
Treasury and FDIC demonstrated zero interest saving shareholders of SIVB (wiped out, the buyer of assets got $16B+guarantees for loans).
Same will go for the rest of $KRE = any assets are at deep dis count.
Can't save them all (nor they would want to).
Industry consolidation.
The End.
The information and publications are not meant to be, and do not constitute, financial, investment, trading, or other types of advice or recommendations...

EWBC - Bearish Rising WedgePrice is within a large triangle structure, which could be classed as a rising wedge
Middle line in dots shows the evident bearish turn, with the strong trend line being broken
Downsides seem to be coming on this Weekly timeframe

EWBC DailyNASDAQ:EWBC daily looks ready to breakout after a double bottom and now bullish EMA activity

EWBC, Triangle Symmetrical Top (bullish)I found this pattern at tickeron website with the following data:
STATUS = Confirmed
CURRENT CONFIDENCE = 71%
TARGET (EXIT) PRICE = 48.35 USD
BREAKOUT (ENTRY) PRICE = 45.52 USD
DISTANCE TO TARGET PRICE = 6.63%
EMERGED ON = Nov 23, closing price
CONFIRMED ON = Nov 24, closing price
WITH CONFIDENCE LEVEL= 74%
The Symmetrical Triangle Top pattern forms when the price of a security fails to retest a high or low and ultimately forms two narrowing trend lines. The price is expected to move up or down past the triangle depending on which line is broken first. The price movement inside the triangle should fill the shape with some uniformity, without leaving large blank areas.
This pattern is commonly associated with directionless markets since the contraction (narrowing) of the market range signals that neither bulls nor bears are in control. However, there is a distinct possibility that market participants will either pour in or sell out, and the price can move up or down with big volumes (leading up to the breakout).
Trade idea
Once price breaks out from the top pattern boundary, day traders and swing traders should trade with an UP trend. Consider buying a security or a call option at the breakout price level. To identify an exit, compute the target price by adding the pattern height to the breakout point. The pattern height is the difference between the highest high and lowest low within the pattern.
To limit potential loss when price suddenly goes in the wrong direction, consider placing a stop order to sell at or below the breakout price.

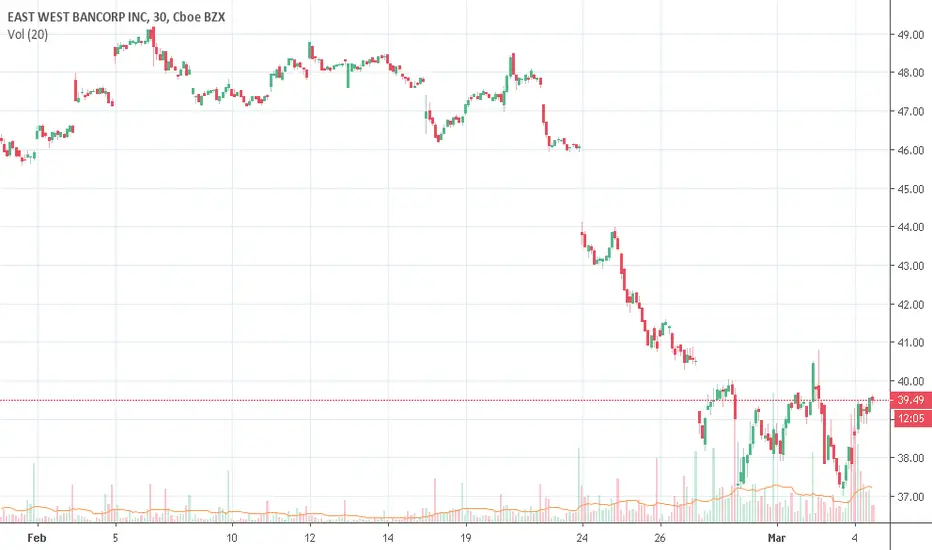
BUY to EAST WEST BANCORP DailyHello my friends, EAST WEST BANCORP has been in a bearish fake dynamic with strong buying volume for a long time and pent-up buyers' attempts. In the TIMEFRAME M1 we can see an abortive sellers attempt and it is going to go and break the VWAP. EAST WEST BANCORP goes on its last next low and comes back in a higher price. Great potential to reach the last high point (See TIMEFRAME H4) then. If the buyers are still in the game, reach the next high with a symbolic number of 39.50.
Please LIKE & FOLLOW, thank you!

East West Bancorp Announces Stock Repurchase Program!!!EWBC: East West Bancorp, Inc.
2020-03-03 20:48:00
East West Bancorp Announces Stock Repurchase Program

EWBC: Long opportunityAn intraday high potential, Back Tested Long Analysis.
We ll try to enter into the correction of the uptrend movement.
DETAILS ON THE CHART
NOTE: Entry range area above the entry point, is calculated upon 80% of the recorded pullback back tested past performances
DISCLAIMER: This is a technical analysis study, not an advice or recommendation to invest money on.

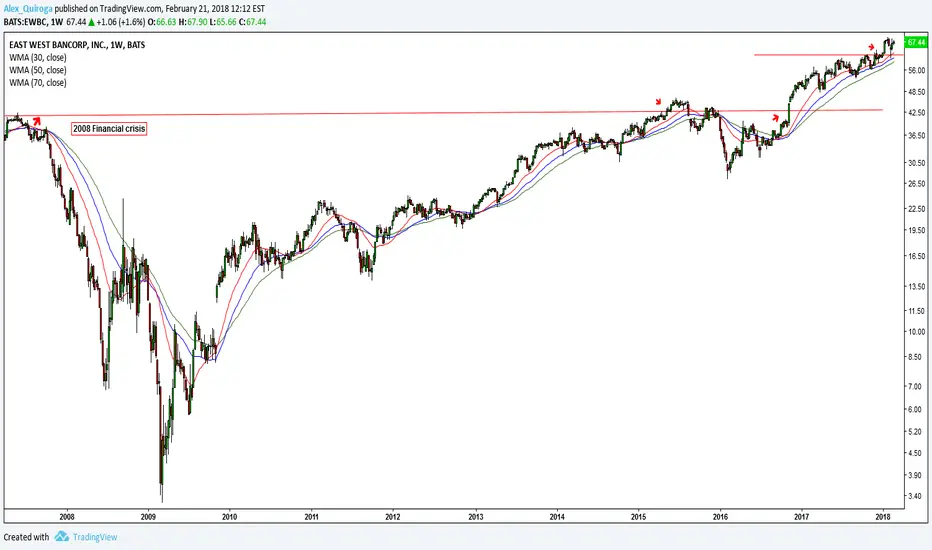
Bank vs. Cryptocurrency #8 (EWBC)In the world of investing happen this. A investor do not know nothing about this company because is a regional bank based in Pasadena, California.
Even me, this is the first time that I listen about (East West Bancorp, Inc.) and I live in other country but in my case, I am not and Investor and I not a Trader.
And for this reason I dot not have a personal bias or emotional feelings about this company. I do not publish things like (Penny Stocks).
This is a highly traded stock. Avg-Volume: 825,898 with a Market Cap: 9.725B.
finance.yahoo.com
And I can make my job: (I find variety of trading opportunities in the whole market based in Price Action)
I follow the Financial Industry (151 Financial Institutions) more other 9 Industries like
Health Care (134 Companies),
Technology (178 Companies),
Capital Goods (173 Companies),
and even I follow Public Utilities (32 Companies)
I have no personal preferences for any industry.
I am Not a Trader, I am Analyst and Stock Picker
Only stocks. I not publish a stock symbol twice.
Only NYSE and NASDAQ (Listed Stocks)
No comments about Technical Analysis (Only watch red arrows)