Exelixis Stock Chart Fibonacci Analysis 080125Exelixis Stock Chart Fibonacci Analysis 080125
Trading idea - Entry point > 37/61.80%
Trading Idea
1) Find a FIBO slingshot
2) Check FIBO 61.80% level
3) Entry Point > 37/61.80%
Chart time frame:B
A) 15 min(1W-3M)
B) 1 hr(3M-6M)
C) 4 hr(6M-1year)
D) 1 day(1-3years)
Stock progress:A
A) Keep rising over 61.80% resistance
B) 61.80% resistance
C) 61.80% support
D) Hit the bottom
E) Hit the top
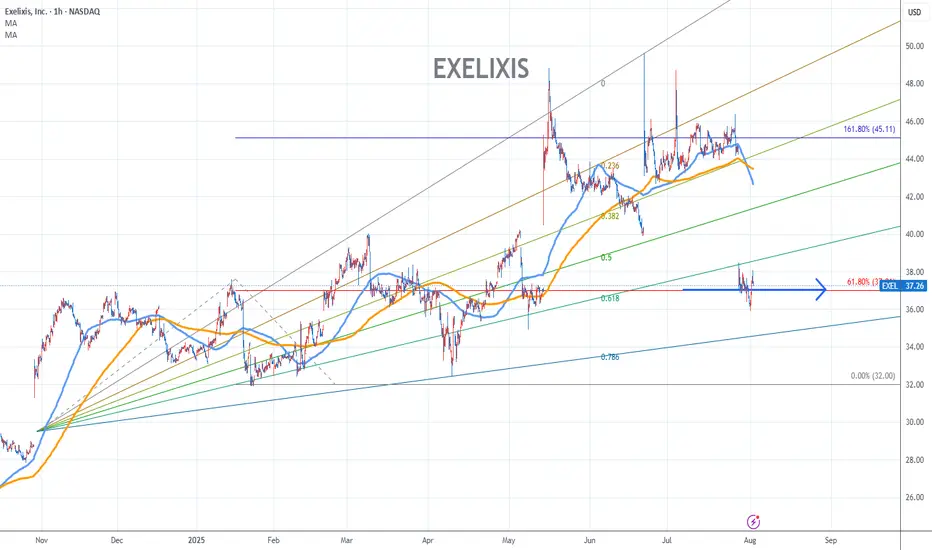
Stocks rise as they rise from support and fall from resistance. Our goal is to find a low support point and enter. It can be referred to as buying at the pullback point. The pullback point can be found with a Fibonacci extension of 61.80%. This is a step to find entry level. 1) Find a triangle (Fibonacci Speed Fan Line) that connects the high (resistance) and low (support) points of the stock in progress, where it is continuously expressed as a Slingshot, 2) and create a Fibonacci extension level for the first rising wave from the start point of slingshot pattern.
When the current price goes over 61.80% level , that can be a good entry point, especially if the SMA 100 and 200 curves are gathered together at 61.80%, it is a very good entry point.
As a great help, tradingview provides these Fibonacci speed fan lines and extension levels with ease. So if you use the Fibonacci fan line, the extension level, and the SMA 100/200 curve well, you can find an entry point for the stock market. At least you have to enter at this low point to avoid trading failure, and if you are skilled at entering this low point, with fibonacci6180 technique, your reading skill to chart will be greatly improved.
If you want to do day trading, please set the time frame to 5 minutes or 15 minutes, and you will see many of the low point of rising stocks.
If want to prefer long term range trading, you can set the time frame to 1 hr or 1 day.
EXEL trade ideas
Trading Journal $EXELHold really well over the market downturn, once it retook prior resistance, and closed above 50 MA, initiated buy position..
Went up ~7% before giving up all of its gains in one day. Exited position at the breach below 50 day MA

Trade Idea: Exelixis, Inc. (NASDAQ: EXEL)EXEL is offering a compelling setup, trading just above its 50-day moving average — a key technical level that has historically provided strong support. The stock belongs to a high-quality company with solid financials, reinforcing confidence in the broader trend.
With the price stabilizing above this important moving average, a small initial long position looks attractive to participate in potential upside continuation.
Entry Strategy:
Enter a small long position just above the 50-day moving average to align with the resumption of bullish momentum.
Risk Management:
Set a protective stop-loss at $35.30, providing a well-defined risk level should the trade move against us.
Important Note:
Be mindful that earnings are scheduled for May 13th, which could introduce heightened volatility. Consider adjusting position sizing accordingly or tightening risk management ahead of the announcement.
DISCLAIMER : The content and materials featured are for your information and education only and are not attended to address your particular personal requirements. The information does not constitute financial advice or recommendation and should not be considered as such. Risk Management is Your Shield! Always prioritise risk management. It’s your best defence against losses.

EXEL Chart Heating Up: Breakout Watch!🔍 Overview:
On the 30-minute chart of EXEL (Exelixis, Inc.), we're witnessing a symmetrical triangle breakout forming near a key confluence of support/resistance. This setup could lead to a potential bullish move if confirmed.
📌 Key Technical Highlights:
Pattern: Symmetrical triangle
Breakout Point: Near $34.85 (marked by yellow circle)
Resistance Levels:
Minor: $36.07 (red)
Major: $37.21 (green)
Support Zone: $34.10 (white line)
Volume: Moderate, needs confirmation with breakout candle
📈 Trade Plan (Long Bias)
✅ Entry Zone: $34.80 – $35.00 (post breakout confirmation)
❌ Stop Loss (SL): Below $34.10 (trendline & horizontal support)
🎯 Profit Targets:
TP1: $36.07 (previous resistance)
TP2: $37.21 (major resistance zone from March highs)
⚙️ Risk-Reward Considerations:
Symmetrical triangle suggests price compression and upcoming breakout
Risk:Reward ratio looks favorable if trade follows upward momentum
Confirmation needed with volume breakout + strong candle close above triangle
📚 Educational Takeaway:
This is a textbook case of price consolidation followed by breakout anticipation. Symmetrical triangles often act as continuation patterns, and when paired with horizontal support and volume analysis, they offer high-probability trade setups.
Traders should always wait for confirmation—breakouts without volume can lead to fakeouts. Set tight stops and manage your trade dynamically as price action unfolds.
✍️ Final Thoughts:
If you're actively trading stocks like EXEL, using clean patterns like this combined with defined entry/exit rules can dramatically improve consistency. Keep watching volume and price action for the final signal.

Setup: EXELEXEL : I have a swing trade setup signal. I'm looking to enter long if the stock can manage to CLOSE above the last candle high(BUY). If triggered, I will then place a stop-loss below (SL) and a price target above it(TP= Sell all or 50%, move SL to breakeven), then using the close below the 10SMA as my trailing stop loss. I like that the last hour candle had high volume showing interest (normally coming from 'Smart Money'). **Note: The above setups will remain valid until the stock CLOSES BELOW my set stop-loss level(SL).

Putting the odds in your favor - $EXEL in a green zone pullbackI've said before that trading with the trend is always something that improves your odds, both long and short. I don't ALWAYS trade with the trend but I like to, especially when there's other compelling reasons to. Putting the odds in your favor is always a smart move when trading.
On this chart I'm using 2 things to illustrate trend. The GC overlay is simply a pair of moving average ribbons that I use to show me the strength of the trend. Yellow above purple is an uptrend. I usually use green and red which are the default colors, but changed the colors for this in case anyone is red/green colorblind.
Almost as important for me, is the gap between the two ribbons. This shows the strength of that trend. You can see that since August, NASDAQ:EXEL has been in a strong uptrend. We like that being the case whenever possible.
Now my algo says oversold (and its input is not disputed by me) but it also incorporates some of this. However, the visual here shows that the oversold signal is just as the price is touching the upper part of the yellow ribbon. IF price had collapsed in a hurry into the bottom part of that ribbon or especially through it, I'd be thinking it was more of a trend reversal signal. This is shown by the circle on the chart back in January and again in early-mid April) rather than a temporary pullback. When the price crashes through that band, it's a warning. Listen to it, especially if you trade trends more than the 'noise' that I trade.
I also like to have these pullbacks occur in the upper half of the regression channel (the green zone). Again, if my algo says "buy" when it's in the red zone, I still listen. But if my algo says buy on two stocks, but one is in the green, and the other is in the red, I'll take the green almost every time.
As always, there are exceptions to the rules, where crashing doesn't signal a trend change or when gradual moves through the band are the beginning of trend changes. But it works often enough to be aware of it. If you open the chart for EXEL and apply this indicator, you'll see lots of other examples where this was a portent of things to come regarding a trend reversal. This works the same way moving up when the yellow ribbon is below the purple one during a bearish period. If there's an upward rip then, the odds just increased for a positive reversal.
I am nothing if not a slave to probability when trading. I don't guess or rely on hunches or what some random "pumper" says, trying to get everyone to be on their side of a trade. I make every trading decision based on probability. You should too. It doesn't mean you''ll always be right, but it will increase how often you are.
When you're designing a trading system, know the probability behind the decision you're making. If you don't, you're just guessing and most people lose money trading because of that. If you're trading a head and shoulders pattern, for example, do you know the win probability behind it? I doubt it. But you should. You're just trusting that because someone else said it works, that it will this time, on this stock, in this never before seen combined environment of variables. Until you test something on THIS stock, under as many possible conditions as you can, don't be surprised when it fails. I try to post backtest results (or at least partial ones) when I post trades, so you can see WHY I trust the decision I'm making.
That testing, and the probability that it indicates, should influence not only the direction of your trade, but stop placements if you use them and even capital allocation. Stronger probabilities warrant stronger conviction and vice versa. I'm not saying if your system says 99% chance of a win, to go all in and then lose it all. Probability and PROBABLY have the same linguistic root for a reason. Probability is NEVER a guarantee. It is a compass for a trade, not military grade GPS.
So in the end, all price action, indicators, and patterns are simply elements that can increase the probability of your trades working out. But knowing how they work, and how reliable they are should be a HUGE part of your prep work for trading, long before you ever risk real money on that trade. If not, I hope that money doesn't matter very much to you - because you're likely to lose it.
I took this trade at the close today. I'm simply looking to turn a profit, so my goal is any gain above my entry price and then get that capital back to work on another idea. I'm adding as long as my algo says it's oversold and selling each lot as it becomes profitable.
EXEL long at 26.06 - wish me luck!
I hope you all realize this post was instructional and not an encouragement to take this trade, so if you decide to trade it, good luck, but do your own research first.

Exel This is the moment right here. My level I’ve been waiting for. Time
To long ?! This will be the third touch at same area we tapped and ran both times last time. Will history repeats ? I will take this chance stops below or cut upon closing candle below support. Good luck

Exel Patience here as we could retest lower support for the 3rd tap. Last 2 tests caused a sick rally. Will the 3rd tap do the same? Or will this support break as we now put in a lower high? I’d be watching 17$ if we hold and bounce, targeting half off at the downtrendinf resistance of the last 2 highs. This next push may reject aroubd 21$ But blasting through could give a dope risk to reward leading to 25/26$. 17$ will be one I am watching heavily

EXCEL - LongsProbably wont be in this until monday as want to see how markets will open.
XBI looking like a leading sector
EXCEL multiple daily closes above EMA cloud + Retest and push higher of 200EMA
HOWEVER - Missing volume on todays move higher.
2 TP marked on chart
Tight stop as always

EXEL LONGSAS PER THE CHART
3 suggested TP indicated
Very strong company - Positive EPS revisions
Biotech looking like it could be the next leading sector

bullish flag? Entry: $23.00
SL: $21.80 (loss 5.4 %) (visual only, close if daily closing price below)
TP: $29 (profit 27 %, ratio 5)
Hello Trader,
Exelixis is building a bullish flag right now. After the upper trend line is broken, a buy signal is created. I like the risk-reward ratio.
Deutsch
Hallo Trader,
Exelixis buildet gerade eine bullische Flagge aus. Nachdem die obere Trendlinie durchbrochen wird, entsteht ein Kaufsignal. Das Chancen Risiko Verhältnis gefällt mir gut.

exelconsolidation on previous resiatnce this is gearing up for a huge pop. might need more time to consildate but man its getting ready! all eyes on this pharma


EXEL - 5.96% Potential Profit - Ascending TriangleI'm cautious with this trade. I don't usually get into positions with a risk/reward smaller than 3.
- Target Entry: $25.65
- Target Stop Loss: $25.05
- Target Exit: $27.19
- Risk / Reward Ratio: 2.57
About me
- Note that I tend to adjust stop losses in order to secure profits early and preserve capital. This means that the target price is going to be achieved as long as there are no strong pullbacks that trigger my new adjusted stop loss


#EXEL Best Bet Video break downBest bet going into next week Holding Calls and expecting explosive move soon. Upcoming catalyst

Long | EXELNASDAQ:EXEL
Possible Scenario: LONG
Evidence: Price Action
TP1 ~ 24.70
This is my idea and could be wrong 100%.

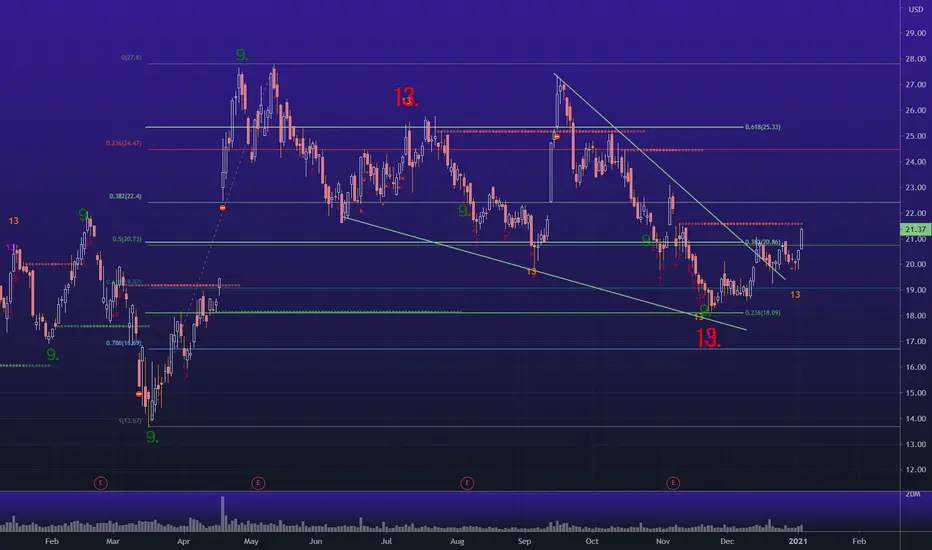
Exelixis is a great opportunityHi guys, hope you are all well. Today we are looking at Exelixis, an oncology-focused biotechnology company that focuses on the discovery, development, and commercialization of new medicines to treat cancers in the United States. The market cap of the firm is roughly $7 billion. What drew me to looking into this company was its cash and cash equivalents value, a whopping $1.2 billion, giving it an almost 20% cash to market cap valuation. The company is forecasted to grow by 40% this year and has absolutely no debt. The P/E is high at a level of 63 however I am not concerned at all by this figure due to the fact that EPS is forecasted to grow by ten fold in the next 3-5 years. From my wave analysis, we can see that the stock consolidated nicely to form its wave 2 and is now in the approach of starting its Wave 3. This is in 1 week time scales, so I do not expect this to be a short term trade. Nevertheless, this really is a fantastic opportunity to possibly triple your investment in the next 2-3 years and I am already positioned in the stock. This is not investment advice, so please do your own due diligence before making any decisions. I hope this is helpful

$EXEL - Upwards Momentum and potential breakout1st published idea for my new process which begins with the stock screener. I am trying to identify stocks that have bottomed out or at least hit a lower resistance that begin to have upwards momentum in the RSI coupled with an EMA crossover event.
Initial Filters:
>2B Market Cap to filter small companies
Debt to Equity Ratio (MRQ) < 0.5 to mitigate some risk
Average Volume (30 day) > 500k -> We need volume for a big breakout
Exchange limited to NYSE and NASDAQ
RSI (56 hrs) > 45 -> In order to have a breakout there needs to be upwards momentum in the RSI
RSI (28 hrs) between 54 and 70 -> shorter term RSI than the other to show upwards momentum.
At any given time this returns around 75 tickers.
Next setup alerts on EMA(40hrs) over EMA(120hrs) and EMA(80hrs) over EMA(200hrs). This will result in only a few alerts per day. As they come out check to see if they fit your standard trend analysis for a potential breakout.
$EXEL fits the bill perfectly. I am active with a target around $26-$27 short term.

Long ideaExelixis, Inc., an oncology-focused biotechnology company, focuses on the discovery, development, and commercialization of new medicines to treat cancers in the United States. The company’s products include CABOMETYX tablets for the treatment of patients with advanced renal cell carcinoma who received prior anti-angiogenic therapy; and COMETRIQ capsules for the treatment of patients with progressive and metastatic medullary thyroid cancer. Its CABOMETYX and COMETRIQ are derived from cabozantinib, an inhibitor of multiple tyrosine kinases, including MET, AXL, RET, and VEGF receptors. The company also offers COTELLIC, an inhibitor of MEK as a combination regimen to treat advanced melanoma; and MINNEBRO, an oral non-steroidal selective blocker of the mineralocorticoid receptor for the treatment of hypertension in Japan. In addition, Exelixis, Inc. is developing XL092, an oral tyrosine kinase inhibitor that targets VEGF receptors, MET, and other kinases implicated in growth and spread of cancer. It has collaboration and license agreement with Ipsen Pharma SAS, Takeda Pharmaceutical Company Ltd., Roche, Aurigene Discovery Technologies Limited, Iconic Therapeutics, Inc., Invenra, Inc., StemSynergy Therapeutics, Inc., Genentech, Inc., GlaxoSmithKline, Bristol-Myers Squibb Company, Merck, Daiichi Sankyo Company, Limited, and clinical collaboration with Ipsen. The company was formerly known as Exelixis Pharmaceuticals, Inc. and changed its name to Exelixis, Inc. in February 2000. Exelixis, Inc. was founded in 1994 and is headquartered in Alameda, California.
Market Cap
$
5.7B
Dividend Yield
Beta vs SPX
0.9
Short Interest
4.6%
Volatility (1Y)
45.4
Hedge Fund Held
Industry
Biotechnology
Competitors
ABBV
AMGN
GILD
VRTX
Performance
14.46
Low
18.39
1-Year Price Range
27.42
High
1M
3M
YTD
1Y
EXEL
-15.8%
-17.3%
4.4%
13.0%
EXEL vs SPX
-19.5%
-23.1%
-8.3%
-4.2%
Valuation
Forward P/E (NTM)
109.9X
Trailing P/E (LTM)
38.4X
Price/Book
3.1X
EV/Sales (LTM)
4.8X
EV/EBITDA (LTM)
25.4X
Capital Structure
Market Cap
$
5.7B
Total Debt
$
48.3M
Cash
$
1.2B
Other
Enterprise Value
$
4.6B
Earnings Estimates
Fiscal Year
EPS
YoY
Sales
YoY
2020
0.46
-54.6%
$
930.7M
-3.8%
2021
0.82
77.4%
$
1.2B
24.5%
2022
1.48
80.5%
$
1.5B
33.4%

$EXEL Exelixis Inc Potential Channel breakout
The company pre announced improved earnings and guidance over the weekend.
stock was in a channel ( bull-flag)
potential entry above POC @ $25
target $27.25

Long | EXELNASDAQ:EXEL
Possible Scenario: LONG
Evidence: Price Action
This is my idea and could be wrong100%