EXEL Daily - Start the RaceNice volume on Friday, recent breakout after 2 months of consolidation, BBs expanding.
EXEL trade ideas


EXEL (not the office one)That is a company which reported just phenomenal earnings.
EPS +400%
revs +100%
will hit 50 in few months.
Technicals:
broke 200 SMA and is in a uptrend for 2 years.
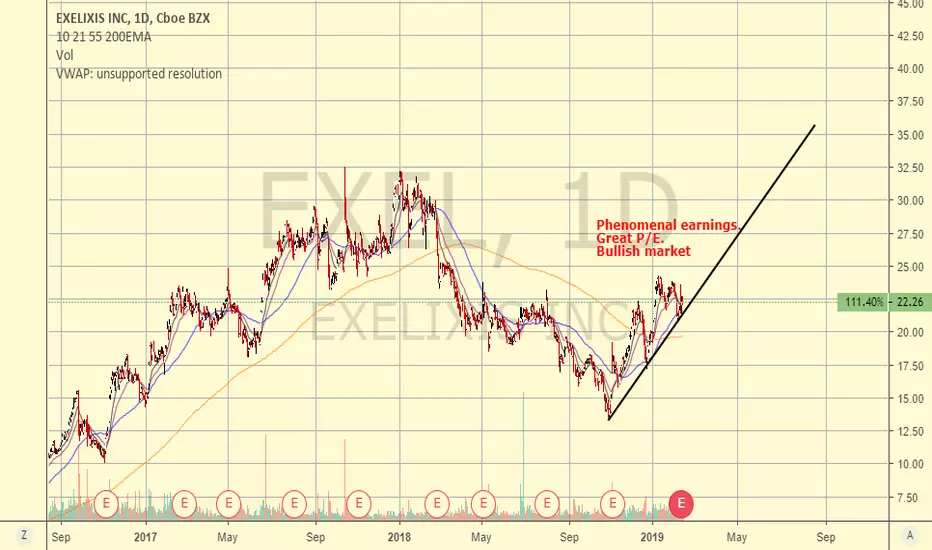

Healthy retracement so far inside regression channel.Rest all on chart.
I am expecting next leg up towards 25 after this Dec-21 options expiry.
Support range : 18~19.

Wants a breakout, but I dont think it'll get oneTarget is $21 in the short term if it does, if not it'll come back down to the $16-17 area. I see a downtrend continuing in my conjecture, but hey, it's investing. If I was great at this I would've retired by now.
Trade safe!

Mega Phone has wide ranges. Blow out sales and strong cash on recent quarter.
Bottom formation is done and should bode well.
Jan-14 : FDA approval for HCC due.


I like it at $11.50I'll take it at $11.50. It completed up to the 3.618 and then looks like it stalled. I took the first leg of money down to formulate the downwards pattern (yellow). I've got it hitting somewhere in the $11-12 range before we see a nice little bounce. I think it'll continue the downtrend more likely than not after that though. If you see a buyout, obviously this thing is going to skyrocket but this is what I've got based on what I've learned/seen in the past couple of months.
Full disclosure - I'm an amateur at this. Use at your own risk.
Thanks!


EXEL to 28 in next 45 trading days.Elliot wave counts marked on the chart.
Regression downtrend channel breakout.
Most positive indicator is Weekly MACD turning positive.
JULY/AUG are seasonally bullish.
Added to SP400 list.
June Monthly candle stick is a bullish hammer.
Good Luck!

EXEL - Upward channel breakdown short from $25.93 to $20.13 EXEL seems breaking down from a Triangle formation in short frame & breaking down an upward channel in the long frame. We think if it breaks below $25.93, it will continue its down move to 20 or lower.
To play this we would consider $27 April Puts
* Trade Criteria *
Date First Found- February 27, 2018
Pattern/Why- Upward channel breakdown short
Entry Target Criteria- Break of $25.93
Exit Target Criteria- 1st Target $20.13, 2nd Target- Momentum
Stop Loss Criteria- $29.13
Indicator Notes- Twiggs money flow sharply declined below Zero line
Special Note- Decent insider selling around $27 price. Would consider $27 April Puts
Please check back for Trade updates. (Note: Trade update is little delayed here.)

My earnings analysis on EXELThere is a nice symmetrical triangle pattern that has formed just in time for earnings. A good indication that a decent move is in store for EXEL depending on the ER.
Green box : gap down here into support we could see some buying off the lower trendline and 100 day SMA, or the 200 day SMA if the price gaps that far. The latter being a much stronger area to buy.
Red box : gap up into resistance we could see some selling. However, if the move is strong enough, the resistance at $32.20 could be broken and she moves higher. At that point look to buy the rest off that old resistance, new support.
Let's see what happens tomorrow for earnings.
Good luck :D

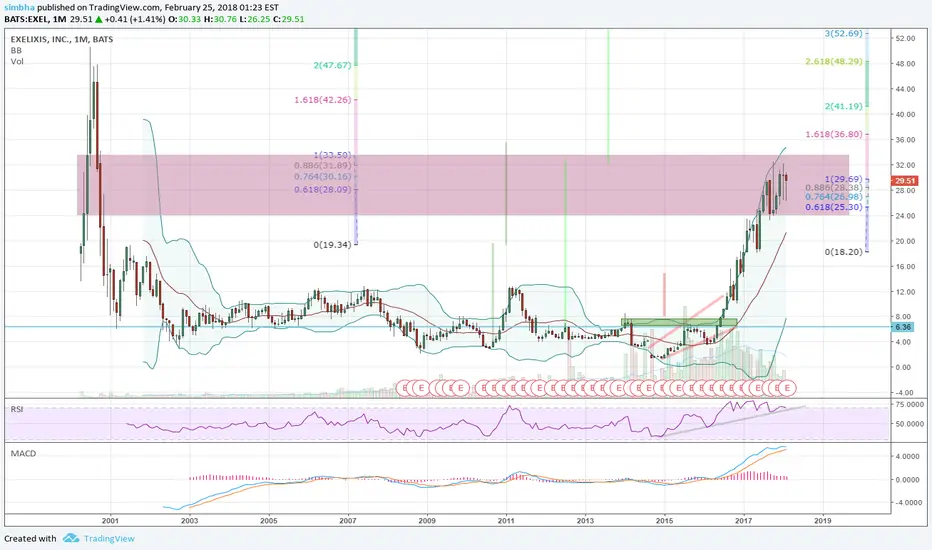
One more push above 33... Kaboom! Consistently performed in FDA approvals for last 2 years.
Last push above 33 sometime this year with accelerating revenues growth... TA roadmap is set.