FFIV trade ideas

$FFIV Bullish Pennant$FFIV Bullish Pennant - monitoring for break of triangle.
See chart for possible path.
Note: Not investment advice.


INSIDERS enter the GAME! - let´s FOLLOW them!!Good morning traders,
I am going to analyze the 2 markets that I opened yesterday. The really fantastic amazing thing behind these trades is, that INSIDERS open their positions too .
And what´s the truth about them?
They have the BEST information about THEIR company . Neither you nor I can ever know what's going on inside those companies.
So if you see INSIDERS increasing their LONG positions in a bull market , prepare for a nice RALLY .
And finally, if you see INSIDERS increasing their SHORT positions in a bear market , prepare for nice SHORT trades .
List of trades:
1) NYSE:EDU
2) NASDAQ:FFIV
Good trading,
Jakub \ FINEIGHT team


F5 Networks Ready for Take-Off!Active trade.
Two phrases: Relative Valuation and healthy fundamentals.
Limit order set for open at 127.04
Stop-loss 123.65 (will probably replace this with a trailing stop if the trade works out).
FFIV | vs. Industry
P/E 19.85 | 44.44
P/S 3.79 | 7.36
ROE: 28.08 | 34.81
ROA: 14.27 | 12.14
FCF/share: 10.66 | 4.65
EPS: 7.08 | 2.98

F5 Network (FFIV) | Strong Support, 50% Growth Potential!Hi,
F5 Networks provides multi-cloud application services for the availability, security, performance, and availability of network applications, servers, and storage systems.
Currently, it is pretty undervalued and the price of the stock has reached inside the strong support area. Technically, it is a pretty powerful support level and it consists of multiple criteria. Do your own research and if you think the company has potential then I let you know - technically it is ready to go upwards!
Technically, the buying area is $120-$130 and it consists of:
1. The price is currently inside a strong price level. It has been multi-year resistance and now it starts to act as a support level.
2. The trendline third touch act as a support level, super crossing area with the previous criterion.
3. Fibonacci 38% and 62% are inside the strong area acting as support levels.
4. Monthly EMA100 should act as a support level.
5. RSI Divergence
6. Two minor trendlines run through the crossing area to adding strength to the buying zone.
7. The fat blue trendline from the top is also called as a counter-trendline. The breakout has occurred a couple of months ago and now the price retests it and the retest should act as a supporter.
8. A bit subjective but still, AB=CD from the top and the D point is inside the strong support level.
As said, do your own fundamental research and if this matching with my technical analysis viewpoints then you are ready to go! If it doesn't match then...skip it!!
A bit cleaner chart :)
Good luck,
Vaido

F5 Networks on watchlist for post earnings move
Looking for continuation after bounce from bottom of channel.
P/e ratio 19
Average analysts price target $155 Hold
F5 Networks, Inc. engages development and provision of software defined application services. It offers the development, marketing and sale of application delivery networking products that optimize the security, performance, and availability of network applications, servers, and storage systems. The company was founded on February 26, 1996 and is headquartered in Seattle, WA.


High risk reversal4/Sep/2019 09:49 AM
--
Poor relative strength in this name. No position, Just an idea.
To have much conviction at all need to have a fundamental narrative or news catalyst come in.
======================

Sell rallies on FFIVHere is a multi-timeframe look at FFIV. The stock recently broke lower out of a long-term corrective channel on the daily chart, setting up a move down to prior support around $125. We're looking for price to retest the trend channel as resistance before continuing lower. Drilling down to a 120m chart, price action doesn't necessarily look impulsive to the downside. However, we can count what may be an ongoing complex correction, with two simple zig-zags connected by a flat correction in the X Wave. This count supports selling rallies on FFIV into $150 for a move down to $130/$125. Initiating a small short position at market and will add to the position as the chart unfolds.

Buy at traingle bottom and support levelAt bottom of triangle and strong support
3 bull bars at bottom with congestion at the support level
Away from 10 EMA
Though today's sell off of s&p 500 it gained
Fundamentals and resting is OK


FFIV looks ready for Earnings RallyFFIV This afternoon had bullish earnings reiteration this afternoon. This is the likely bounce point I would expect for an earnings run up.

$FFIV Oversold at Support$FFIV Oversold at Support - After recent correction, RSI now pushing toward oversold territory.
Expecting ~$183.50 support to hold today and see a bounce in the near term.
Medium term target - $210 by early December
Note: Informational analysis, not investment advice.


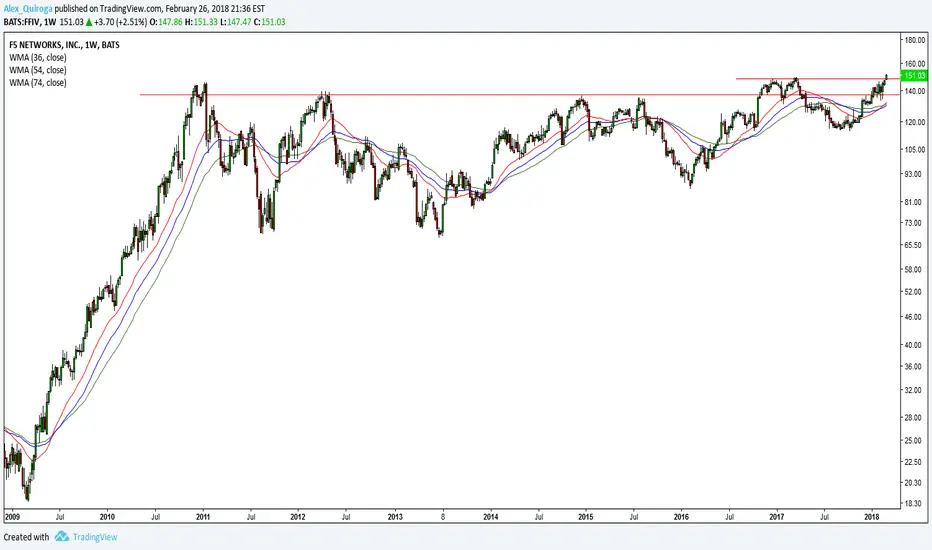
Technology stocks for 2018 #12 (FFIV)Sector: Technology
Industry: Business Software & Services
7 Years of resistance around the 138.00 and was broken, in January 2018 and now 02/26/2018 is breaking the second resistance level in the 148.00 area
Follow the trend but wait for a price retracement