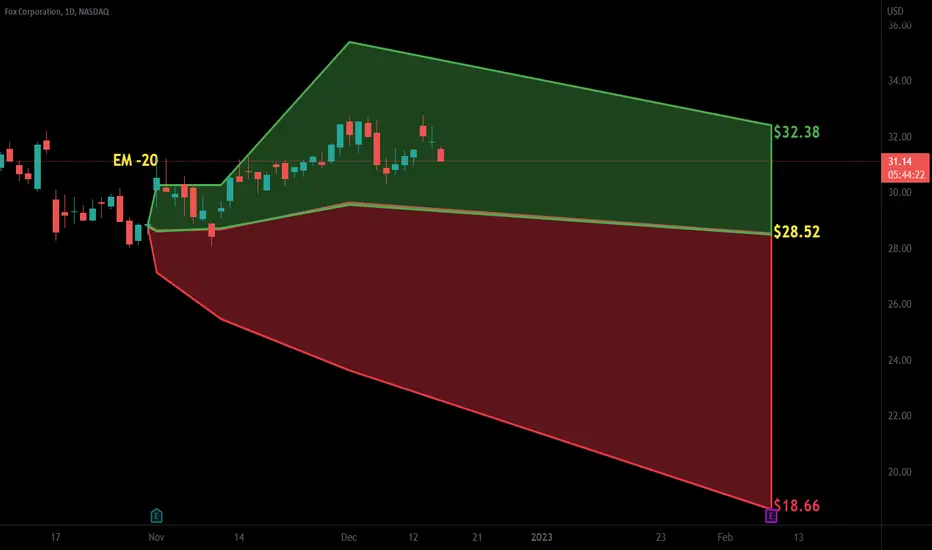
$FOXA with a Bearish outlook following its earnings #Stocks The PEAD projected a Bearish outlook for $FOXA after a Positive over reaction following its earnings release placing the stock in drift B with an expected accuracy of 100%.
FOX trade ideas
If you cant take the heat, get out of the kitchen.Long road ahead,but if you can take it, you will be rewarded.

$FOX with a Bearish outlook following its earnings #Stocks The PEAD projected a Bearish outlook for $FOX after a Positive over reaction following its earnings release placing the stock in drift B with an expected accuracy of 33.33%.

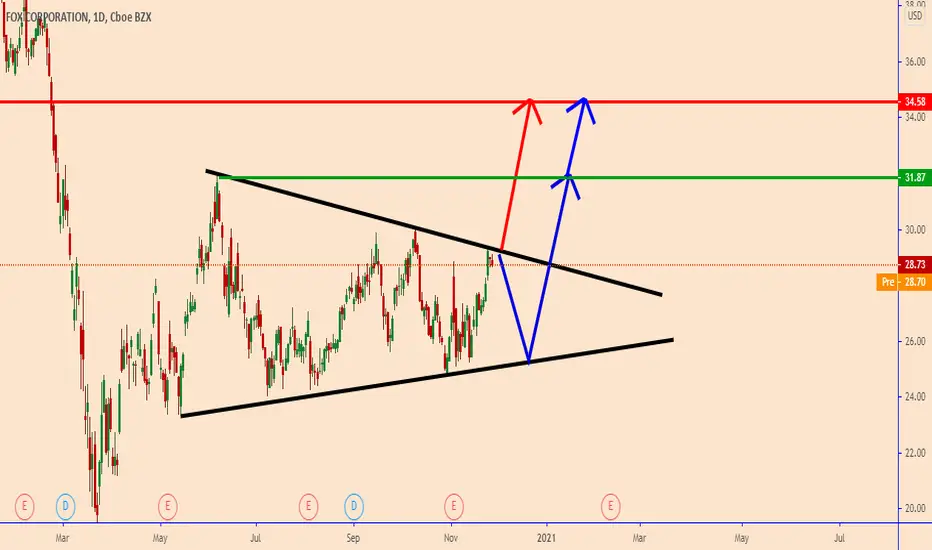
Fox Corporation breakout timingWe're staring at nothing but reverse H&S.
Overall look.
For 3 years the attempts taken to push the price significantly above $40 have failed. Establishing the strong resistance level of just above 42.
Breaking above 2 dashed lines is a signal of breakout in action.
According to fibs the volatility shift will begin on summer.


fox direction there are big resistance push from the seller which make the last candle (spring box)
I guess it will go down in the coming hours
- shape candle
-high in the volume indicator
- broke a downtrend so usually there is a bull back

#FOXA RSI divergence Daily
NASDAQ:FOXA
-Divergence RSI daily confirmation on going
-ATH resistance level nearly reached
-Short to be considered, market to be watch on monday

channel breakoutIt could be a good opportunity for channel breakout. Go short selling with suitable trigger.

fox I call the attention of the company FOX because of the wave count and the current additional price the RSI marks good taking of positions with a risk lower than the profit, that speaks to us the technical analysis and the others?

Fox Corporation Announces $2 Billion Incremental Stock RepurchasFOX: Fox Corporation
2021-06-17 16:00:00
Fox Corporation Announces $2 Billion Incremental Stock Repurchase Authorization

$FOXA FOX CORPORATION and its fantastic budget dataMy Marketmiracle advisor generated an input signal for the $FOXA stock with an ambitious target of 42.43 USD and a potential profit of 13.95%
Incusiorite I analyzed the graph and the first thing I noticed is that the presented balance sheet data are decidedly above the estimates of analysts.
Surely this is an aspect to consider but that alone already justifies such a consistent appreciation.
So I expect price behaviour like the one I drew freehand.
This idea is based on a signal generated by the advisor Marketmiracle, down on this page you will find the link to the page of signals of the advisor that you can see for free without any cost or registration


FOXA - Good risk/reward NASDAQ:FOXA
- Good risk/reward ratio (2.05)
- #FOXA recent pullback got stopped on the 50MA
- MACD sloping up
- Low RSI
Entry at $ 37.71
Target at $ 42.68
Stop loss at $ 35.18

Bias: UpOverall still in uptrend, price stall at upward trendline and support zone. Expecting more bullish movement soon. Make sure to apply SL & TP.


Traditional|FOXA|LongLong FOXA
Activation of the transaction only when the blue zone is fixed/broken.
The author recommends the use of anchoring fixed the blue zone, this variation is less risky.
If there is increased volatility in the market and the price is held for more than 2-3 minutes behind the activation zone after the breakdown, then the activation of the idea occurs at the prices behind the activation zone.
The idea is to work out the resistance level .
* Possible closing of a trade before reaching the take/stop zone. The author can close the deal for subjective reasons, this does not completely cancel the idea and is not a call to the same action, you can continue working out the idea according to your data, but without the support of the author.
+ Maybe right now we will go even lower, then it's okay, the idea is not activated and simply canceled.
+ ! - zone highlighted by the ellipse is a zone of increased resistance, in this area there is a possible reversal for a correction, please take this factor into account in this transaction.
The "forecast" tool is used for more noticeable display of % (for the place of the usual % scale) of the price change, I do not put the date and time of the transaction, only %.
Blue zones - activation zones.
Green zones - take zones.
Red zone - stop zone.
Working out the stop when the price returns to the level after activation + fixing in the red zone.
Orange arrow - the direction of take.
The red arrow - the direction of the stop.
SUM PNL: This parameter displays the total % of all closed ideas of the "new" format (according to the author) for this sector at the time of publication of the idea. The calculation is very "clumsy" just the sum of the profits of all the ideas, based on this indicator, you can more accurately assess the risks when working with my ideas of this sector. I present you the construction of the idea, you can use it yourself as you like based on your subjective view and risks, the calculation of the PNL indicator is carried out only on transactions that the author closed on TV in manual mode or by take.
P.S Please use RM (risk management) and MM (money management) if you decide to use my ideas, there will always be unprofitable ideas, this will definitely happen, the goal of the system is that there will be more profitable ideas at a distance.


FOXA: Short term retracementWeaken candle movement detected, expecting a short term fall of price.
Suggested entry 33.97

Fox Corp. Buy📈 NASDAQ:FOXA Long D1
🛒Buy above = 32.99
🎯Target1 = 34.79
🎯Target2 = 37.71
🎯Target3 = 40.63
⛔️Stop-loss = 30
❌Cancel trade = 30.40


Fox News ShortFox News Short Thesis: 1) death rates higher for fox news viewers www.youtube.com 2) Fox news ratings plummeting after calling election for Biden time.com 3) Fox news actively threatening guests not to appear on Newsmax www.businessinsider.com
dilille010
risk reward of 4.3 for stop loss 30.36 and target of 21.27

FOX Hole Unusual selling pressure on FOXA. The triple top is concerning. Especially on a huge up day
