FROG RISKAs of mid-May 2025, here’s the latest on JFrog Ltd. (NASDAQ: FROG):
📈 Stock Price
Current Price: Around $40.43 (as of May 12, 2025)
Post-Trading Price: $41.25
52-Week Range: $22.91 – $43.00
Market Cap: Approximately $4.63 billion
P/E Ratio: ~124.05 (normalized)
Dividend Yield: 0% (no dividend)
🏢 Co
Next report date
—
Report period
—
EPS estimate
—
Revenue estimate
—
−0.71 USD
−69.24 M USD
428.49 M USD
96.78 M
About JFrog Ltd.
Sector
Industry
CEO
Shlomi Ben Haim
Website
Headquarters
Sunnyvale
Founded
2008
ISIN
IL0011684185
FIGI
BBG006PWZX16
JFrog Ltd. engages in the provision of an end-to-end, hybrid, universal development operations platform that powers and controls the software supply chain, which enables organizations to continuously and securely deliver software updates across any system. It operates through the following geographical segments: United States, Israel, India, and Rest of World. The firm is also involved in creating software delivered without friction from developer to device. The company was founded by Frederic Simon, Shlomi Ben Haim, and Yoav Landman in 2008 and is headquartered in Sunnyvale, CA.
Related stocks
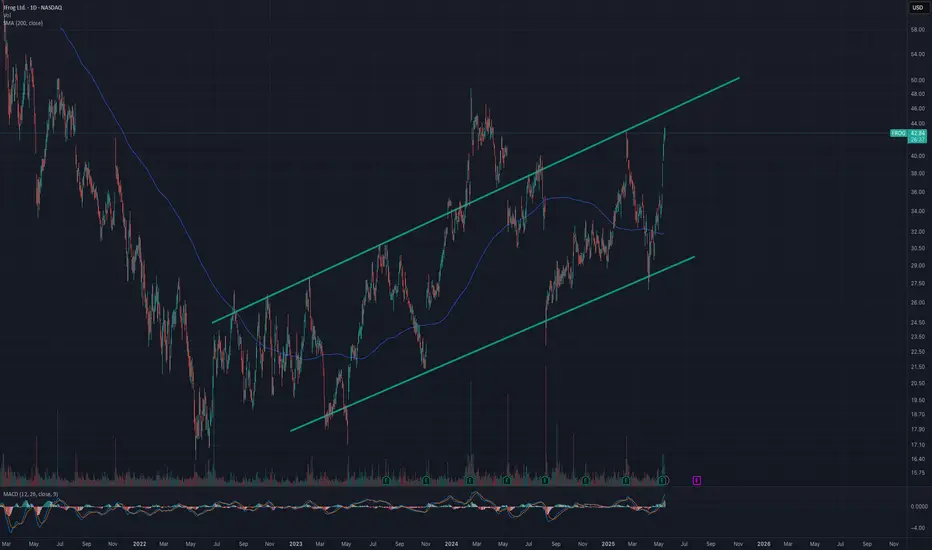
$FROG - About to fly! 129% Upside potentialNASDAQ:FROG
As I've been calling out for the past month Tech Services and SaaS companies are the next phase of Ai and very hot right now based on the massive moves after meh to good earnings from the likes of NASDAQ:TEAM NASDAQ:MNDY NYSE:NET NASDAQ:CFLT
I believe this trend continues and

Frogification & Fibonacci Retracements From SupportsSomething I like to do (although not as much as I want to) is approximate a support trendline in a clear uptrend, and obtain Fibonacci retracements from this support.
A non-arbitrary method is to return retracements from the support using a relevant swing high, the retracements will have the same a

I Am So So Frog I have seen some of you claim for a pre-cup on FROG 15m! Indeed It hasn't been unnoticed.
I shall remind you that a high degree of variation around a "cup" lowers its validity, what might you say to this?
Assuming we have a model y representing our underlying trend, the degree of variation aroun

5/9/24 - $frog - jump before u get boiled here. down > up5/9/24 - vrockstar - i genuinely don't think there's a valuation we'll agree that's ownable toward where the stock is parked. 60c this year on 50x? $30 stock. "yes" but look at that EPS growth, it's 100% yoy... yes but it's 70c the following year and trust me it's probably not going to cagr 50%. if

FROG 2024-03-19 looks like want to jump higherNASDAQ:FROG looks bullish
- good revenue growth & cashflow
- consolidate tightly for a while
- it depends on FED meeting this week, but it looks like it's ready to go higher
- Could be a good entry with low-risk (tight stoploss < 5%)

Bullish Parallel Channel??! Trade the channel!Beautiful consistent bullish parallel channel.
0% debt company, primed for growth.
Beautiful buying opportunity once it reaches the bottom of the channel.
Please use proper risk management.
Thanks!

$FROG Breaking out of PEG Pennant?I have been watching NASDAQ:FROG since the Power Earnings Gap on Nov 2nd. It pulled in nicely and I should have bought it on Nov 13, but I missed it. It has since pulled back again and looks to be breaking out of this consolidation area.
I have started a ¼ size position with a stop below today’s

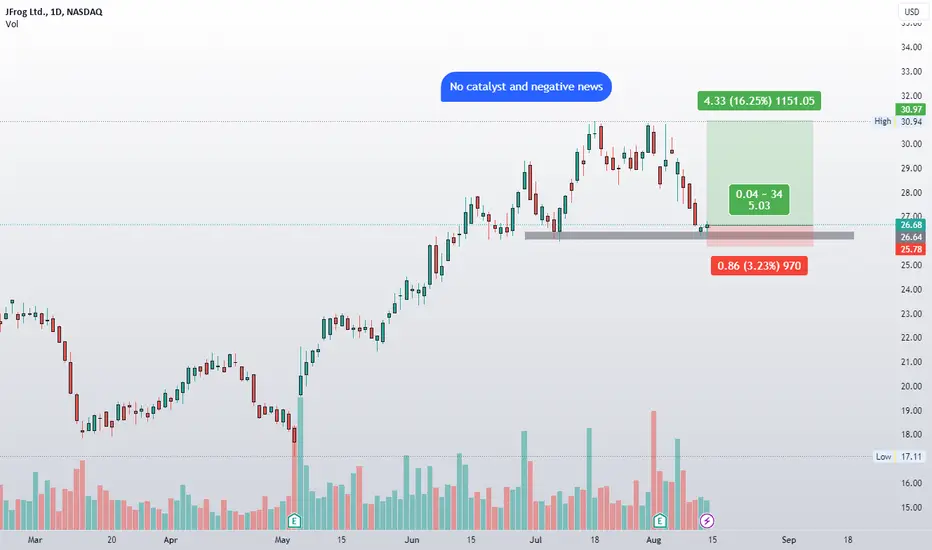
$FROG - Strong SUPPORT, Potential BUY playFundamental analysis:
NASDAQ:FROG reported earnings of $0.04 per share on revenue of $84.17 million for the second quarter ended June 2023. The consensus earnings estimate was $0.05 per share on revenue of $82.96 million. The revenue grew 24% year on year.
Technical analysis:
Strong support
Weekly chart on $FROG is primeNASDAQ:FROG
Weekly chart on NASDAQ:FROG looks ideal for a good move above $29. Options are almost non existent. So will have to go in with stock buy if clears buy point. Good fundamentals too.

See all ideas
Summarizing what the indicators are suggesting.
Neutral
SellBuy
Strong sellStrong buy
Strong sellSellNeutralBuyStrong buy
Neutral
SellBuy
Strong sellStrong buy
Strong sellSellNeutralBuyStrong buy
Neutral
SellBuy
Strong sellStrong buy
Strong sellSellNeutralBuyStrong buy
An aggregate view of professional's ratings.
Neutral
SellBuy
Strong sellStrong buy
Strong sellSellNeutralBuyStrong buy
Neutral
SellBuy
Strong sellStrong buy
Strong sellSellNeutralBuyStrong buy
Neutral
SellBuy
Strong sellStrong buy
Strong sellSellNeutralBuyStrong buy
Displays a symbol's price movements over previous years to identify recurring trends.
Frequently Asked Questions
The current price of FROG is 42.70 USD — it has increased by 0.52% in the past 24 hours. Watch JFrog Ltd. stock price performance more closely on the chart.
Depending on the exchange, the stock ticker may vary. For instance, on NASDAQ exchange JFrog Ltd. stocks are traded under the ticker FROG.
FROG stock has risen by 1.57% compared to the previous week, the month change is a −1.64% fall, over the last year JFrog Ltd. has showed a 7.41% increase.
We've gathered analysts' opinions on JFrog Ltd. future price: according to them, FROG price has a max estimate of 50.00 USD and a min estimate of 40.00 USD. Watch FROG chart and read a more detailed JFrog Ltd. stock forecast: see what analysts think of JFrog Ltd. and suggest that you do with its stocks.
FROG reached its all-time high on Oct 26, 2020 with the price of 95.20 USD, and its all-time low was 16.36 USD and was reached on May 12, 2022. View more price dynamics on FROG chart.
See other stocks reaching their highest and lowest prices.
See other stocks reaching their highest and lowest prices.
FROG stock is 1.86% volatile and has beta coefficient of 1.19. Track JFrog Ltd. stock price on the chart and check out the list of the most volatile stocks — is JFrog Ltd. there?
Today JFrog Ltd. has the market capitalization of 4.89 B, it has decreased by −0.64% over the last week.
Yes, you can track JFrog Ltd. financials in yearly and quarterly reports right on TradingView.
JFrog Ltd. is going to release the next earnings report on Aug 7, 2025. Keep track of upcoming events with our Earnings Calendar.
FROG earnings for the last quarter are 0.20 USD per share, whereas the estimation was 0.16 USD resulting in a 22.32% surprise. The estimated earnings for the next quarter are 0.16 USD per share. See more details about JFrog Ltd. earnings.
JFrog Ltd. revenue for the last quarter amounts to 122.41 M USD, despite the estimated figure of 117.43 M USD. In the next quarter, revenue is expected to reach 122.76 M USD.
FROG net income for the last quarter is −18.50 M USD, while the quarter before that showed −23.20 M USD of net income which accounts for 20.24% change. Track more JFrog Ltd. financial stats to get the full picture.
No, FROG doesn't pay any dividends to its shareholders. But don't worry, we've prepared a list of high-dividend stocks for you.
As of Jul 29, 2025, the company has 1.6 K employees. See our rating of the largest employees — is JFrog Ltd. on this list?
EBITDA measures a company's operating performance, its growth signifies an improvement in the efficiency of a company. JFrog Ltd. EBITDA is −66.36 M USD, and current EBITDA margin is −14.92%. See more stats in JFrog Ltd. financial statements.
Like other stocks, FROG shares are traded on stock exchanges, e.g. Nasdaq, Nyse, Euronext, and the easiest way to buy them is through an online stock broker. To do this, you need to open an account and follow a broker's procedures, then start trading. You can trade JFrog Ltd. stock right from TradingView charts — choose your broker and connect to your account.
Investing in stocks requires a comprehensive research: you should carefully study all the available data, e.g. company's financials, related news, and its technical analysis. So JFrog Ltd. technincal analysis shows the buy rating today, and its 1 week rating is strong buy. Since market conditions are prone to changes, it's worth looking a bit further into the future — according to the 1 month rating JFrog Ltd. stock shows the buy signal. See more of JFrog Ltd. technicals for a more comprehensive analysis.
If you're still not sure, try looking for inspiration in our curated watchlists.
If you're still not sure, try looking for inspiration in our curated watchlists.