GH 3D: breakout forming inside ascending channelThe price of GH continues consolidating within the top of an ascending channel, confirming bullish structure. The rectangular accumulation has lasted for over three months, with price staying above all major EMAs and MAs - a strong trend confirmation. On the last impulse, volume increased, and now the price is compressing again. A breakout with a retest would serve as a valid entry. First target lies near 61.38, second at 73.66, and third at 87.37 - aligned with the upper range of the medium-term Fibonacci extension. Fundamentally, GH remains a promising biotech pick amid sector rotation and potential Fed easing. EMAs and MAs sit below price, and D/A supports the breakout scenario. Waiting for confirmation before entering.
GH trade ideas

GH (Guardant Health) — Breakout Setup with Strong Upside PotentiGuardant Health (GH) is showing signs of completing a long-term accumulation phase and transitioning into a bullish trend. After breaking out of a major descending trendline and holding above key resistance at $38.30, the stock entered a tight consolidation range — a classic base formation before a potential breakout.
Technical Highlights:
– Confirmed trendline breakout
– Price is consolidating above previous highs
– Entry zone around $50–$51
– First target: $70 (+40%)
– Second target: $103 (+100% from current levels)
Fundamental Support:
Guardant Health is a leading precision oncology company specializing in liquid biopsy technologies for cancer screening and monitoring. The company continues to expand its product offerings, especially in early cancer detection — a market with huge long-term growth potential. Recent news includes positive developments in clinical trials and expanded partnerships, which could significantly boost revenue.
Institutional interest in GH has also been rising, with increased buying activity visible in the most recent 13F filings. The overall market sentiment toward biotech stocks with strong data pipelines is improving, which further supports the bullish outlook.
Conclusion:
GH is a strong candidate for medium- to long-term growth. The technical setup aligns with a fundamental narrative of innovation and market expansion. Partial profit-taking could be considered at $70 and $103. Due to the volatility of biotech stocks, proper risk management and position sizing are essential.

Guardant Surge: Targeting a Clean Breakout!”“Guardant Surge: Targeting a Clean Breakout!”
📝 Trade Breakdown:
🧬 Setup:
GH is showing a strong breakout retest pattern after breaking above consolidation near $48. The price is holding above support, forming a higher low with momentum.
📍 Entry: ~$49.53 (post-breakout retest)
🎯 Target: $52.40 (resistance/TP zone)
🛡 Stop Loss: ~$48.20 (below yellow support zone)
📊 Risk-Reward: ~2:1 — attractive and calculated
🔍 Technical Confirmation:
🔼 Retest of prior resistance turned support.
✅ Trendline + horizontal support convergence.
🔋 Strong prior volume push from $42–$50 range.
🎯 Caption Idea:
“GH is charging forward with a clean breakout setup! Holding above $49 could ignite a rally toward $52+.”

In the Genes for GH’s Path.Guardant Health is building strong bullish momentum, with a gap forming around the $21.50 level. A breakout above the $26.37 resistance would signal further upward movement, targeting the $37.05 weekly resistance. With an appealing 3.6 risk-to-reward ratio, this trade offers an attractive short-term opportunity, while a stop-loss at $19.19 ensures effective risk management.
In the longer term, Guardant Health’s bullish outlook could extend to $41.06, supported by its advancements in precision oncology and liquid biopsy technology. With growing adoption of early cancer detection and genomic testing, Guardant Health is positioned to capture increased market share as demand for cutting-edge diagnostics rises. For those with a longer-term view, holding with a $19.19 stop-loss provides an opportunity to capture potential upside while managing downside risk.
This combination of technical momentum and Guardant Health’s strong positioning in the healthcare innovation space supports a bullish push toward $37.05, with a longer-term target of $41.06.

Guardant Health (GH) - Double/Triple bottom incoming The chart shows a strong bearish trend that started in February 2021 and is not finished yet. It coincides with an ABC wave pattern of Elliott's Wave Theory. Despite this, it is likely that the price is near the end of this downtrend with the possibility of a new upcoming impulse. This is due to the fact that wave C of the ABC is forming its last wave 5.
It is possible to exploit two important inversion signals: the divergence between RSI and the price + the potential end of wave 5 close to the previous minimum, forming a double bottom. They are both important signals of inversion, but before opening a position, it is important to wait for the price confirmation.
How to play this trade? First, wait for the breakout of the static and dynamic resistances on the RSI. Once a candle closes above these levels, proceed with a market entry of half of the capital for this trade. Second, wait for the confirmation of the double bottom pattern. Set an entry with the remaining capital at around $30.5/31.
The first target is set at $40.5 with a 32.8% profit, which is the target point expected once the double bottom is confirmed. There could be a second target point, which is a potential confirmation of a triple bottom pattern, and should be set at about $60 with a ~100% profit.

biotech and GH looking to trend upwardGH and a few others looking to continue ascending channels/triangles into possible upward breakouts, 40+ impending

GH dead cat bounceGuardian Health has had nothing more than a dead cat bounce along with the overall market today, the long term chart is in a nasty downtrend and we're in a bear market, rallies are to be sold, not bought

Complete novice here - am I right that Guardant is one to watch?Hello! I'm a complete beginner, so I just want to see if my process is right or way off. Guardant is a player in highly anticipated precision health market. I ran a stochastic oscillator and it looks like the asset is just coming out of a long period of oversold levels (literally about to come over the 20% mark as of 12 April 2021) and looks like the time to buy for that reason. To temper that a little, I looked at the Price Volume Trend (Investopedia says this is the right thing to do to best avoid false signals), and it showed a slight but stable looking increase. Makes me think that it's one to watch carefully to see where this goes. If I'm way off - what should I be looking at instead?

Bottom FishingGH hit the bottom, snapped back up, and has not stopped since!
This one I did buy at the bottom, but not enough, planning to get more shares later. GH has not cooperated with my plan as of yet )o: So I am hoping a pull back occurs soon. Bottom dwellers usually stay on the bottom longer than GH did as I do a lot of bottom fishing. Price is at resistance from a former red candle. There is a lot of green so may be selling will start soon.
The moving averages still look bad, but the 50 SMA is stabbing price today. Moving averages rarely look appetizing on deep pull backs or bottoms. It is considered a step in the right direction when price is above the 50.
GH does appear to have formed a very large harmonic pattern.
A good long entry level is important for those who want to hang.
No recommendation.
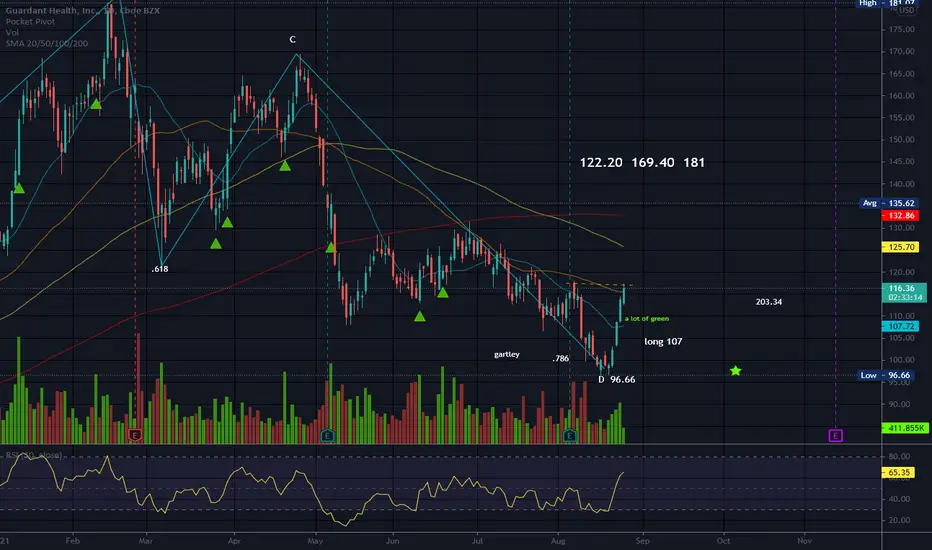
TRADE JOURNAL (#2): LONG GHNASDAQ:GH :
Price pullback to previous breakout level around $112. Currently testing the lows prior to the breakout, which is a good support zone (support and resistance).
The level that price is currently testing also happens to be the price of the 61.8% Fib. retracement @ $98.20. This would be a good support zone for price to consolidate before the next move higher (Fib. ret)
S/L is placed below its prior lows, which is wide taking into account current market sentiment;
T/P is at the 1.382 Fib ext level, coinciding with the 1.618 Fib ext of the current retracement ( 21Jan 21 - current).
This is a swing trade after a deep retracement of the price. Will monitor price as markets could turn sour and test the 76.4% retracement levels, or even the low of $55.75

Beautiful, Textbook Cypher HarmonicAs the title suggests, GH demonstrating the power of the highly profitable Cypher harmonic pattern with still more upside left before the TP zone.

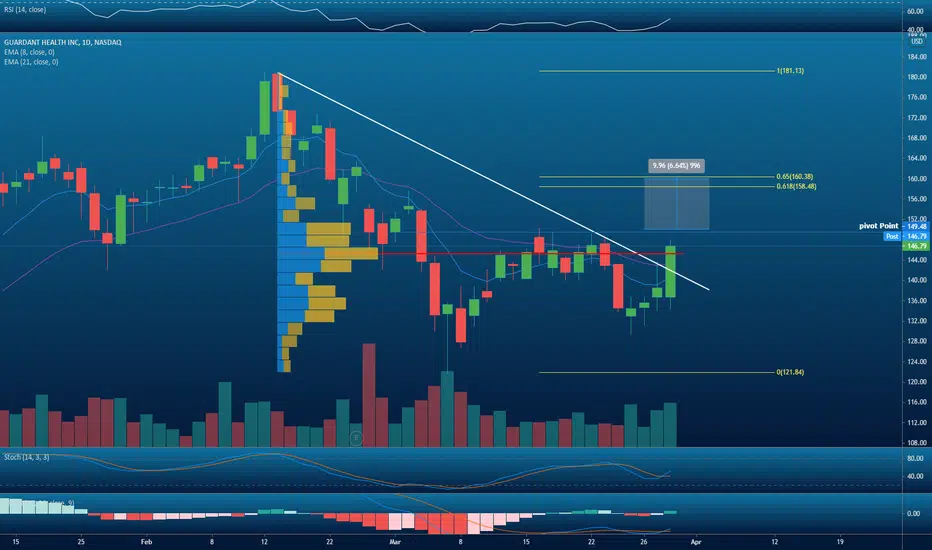
$GH Guardant Health Breakout trade Setup
Major downtrend break today -
- Broke above the POC
- broke above the momentum EMA's
Potential long above $150
Target price $160.

Something we might missed - Why i buy Guardant Health IncHi Fellow Viewer.
There is 3 reason why i buy Guardant Health Inc
1. Industry well known product
Guardant360 and GuardantOMNI both are wide use and essential uses in cancer treatment, those product assists healthcare professionals match cancer patients with the best treatment options. The advantages of product is faster diagnostic, reduce of the treatment, and excellent health results.
2. Strong revenue growth
If you check link below (yahoo finance), you will be surprised the company revenue has hiked from year 2017 49m to year 2019 214m. Mostly leading by sales of the Guardant360 and company expecting sale is continue trending upward this year.
3. Technical analysis
Price tested MA 200 and rebound, and MACD line is above signal line
*For more details relating to company product please check company website.
*Company Financial info from yahoo finance

GH , Short This is a technical based short.
Reasons for entry :
-RSI overbought - 74.87 and we see a reversal
-Trading above avg target price $141.67
-Within 5% of 52 Week high .
Profit targets achieved using Fibonacci re-tracement, I like 0.618 level, it looks good with the blue prior resistance trend line (which is now the support should we continue it up the chart) .
Good Luck ~

GH, Technical short RSI, Volume and Chart support an entry . However, we do not have a proper sell signal on MACD , which I normally do not use but decided to add it on for this idea . I still think the risk is acceptable to enter with a small position ( just over 1% of account ).
Target is 0.618 fib level.
Looking at the fundamental metrics I also don't see anything too alarming so I will try to take advantage of a smaller price movement here only .

GH Potential False BreakoutLooking for this to hold over 133$. PT = 145$ if it holds, otherwise you'll see a drop to 125$ at least.


GH Reached its #ChartPattern #PriceTarget #AscendingTriangle I posed about this trade forming on August 9th link below. GH reached its ascending triangle price target.

$GH 2 month #Ascending #Triangle #ChartPatternNASDAQ:GH has been moving sideways for 2+ months forming an ascending triangle with a very well defined resistance line. The stock reported earning last week and looks set to breakout this week.


