The Hackett Group, Inc.
Middle Band (SMA): The price is currently trading around this line, which typically represents a moving average, suggesting equilibrium between buyers and sellers at this level.
Current situation: The price is consolidating around $25.86, slightly above the 20-period simple moving average, indicating that bulls are trying to hold this level.
Resistance: A strong resistance can be seen around the $27.50-$28 range, which aligns with the recent highs.
Support: The $25.00 level, which aligns with the middle Bollinger Band, serves as a potential support level. Below this, there is support around $23.00.
The recent decline in volume suggests weakening momentum, which could indicate a period of consolidation or a potential reversal.
Bullish Case: If the price breaks above $27.50, it may attempt to retest the previous highs around $28 or higher.
Bearish Case: A failure to hold the $25.00 support level might lead to a drop toward the lower Bollinger Band around $23.00.
The current consolidation phase around $25.86 suggests that the market is indecisive, and watching how the price reacts to support/resistance levels will give a clearer direction.
HCKT trade ideas

THE HACKETT GROUP, INC. - [HCKT]Bollinger Bands :
The price has recently broken above the middle Bollinger Band (typically the 20-day moving average), which is a bullish signal.
The upper Bollinger Band is trending upwards, suggesting increased volatility and potential continuation of the current upward movement.
The price is near the upper band, indicating the stock might be in an overbought condition, potentially leading to a pullback or consolidation.
Volume :
There is a noticeable increase in volume on the recent bullish candles, suggesting strong buying interest.
The high volume on the most recent trading day could be indicative of strong conviction in the current price movement.
Candlestick Patterns :
The last candle is a bullish one, showing a significant price increase of about 2.34%. This suggests strong momentum in favor of the bulls.
The large wick on the upside during the past few sessions could indicate some resistance around the $27 level.
Support and Resistance Levels :
Resistance :
$27.68: Recent high and upper Bollinger Band level. This is a key resistance that the price needs to break through to continue the upward movement.
Support :
$25.55 - $26.00: Recent area of consolidation and the middle Bollinger Band, providing short-term support.
$24.00: The 50-day moving average is a strong support level.
Trend Analysis :
The daily chart shows a strong uptrend with higher highs and higher lows, supported by both the moving averages and Bollinger Bands.
If the price can break above the recent high of $27.68 with strong volume, it could lead to further upside potential.
Conclusion :
Bullish Scenario: If the price continues to stay above the 50-day moving average and breaks above the $27.68 resistance level, it could lead to further upside momentum.
Bearish Scenario: If the price fails to break through the $27.68 resistance and experiences a pullback, watch for support around the $25.55 - $26.00 level. A break below the 50-day moving average would be a bearish signal.
Monitoring the price action around the $27.68 resistance level and the reaction to any pullbacks will be crucial in determining the next direction.


Major Breakout. Back test complete next stop mid 30sFalse breakdown on monthly. Flag breakout on daily chart coming off of double botttom. Back test complete next stop mid 30s

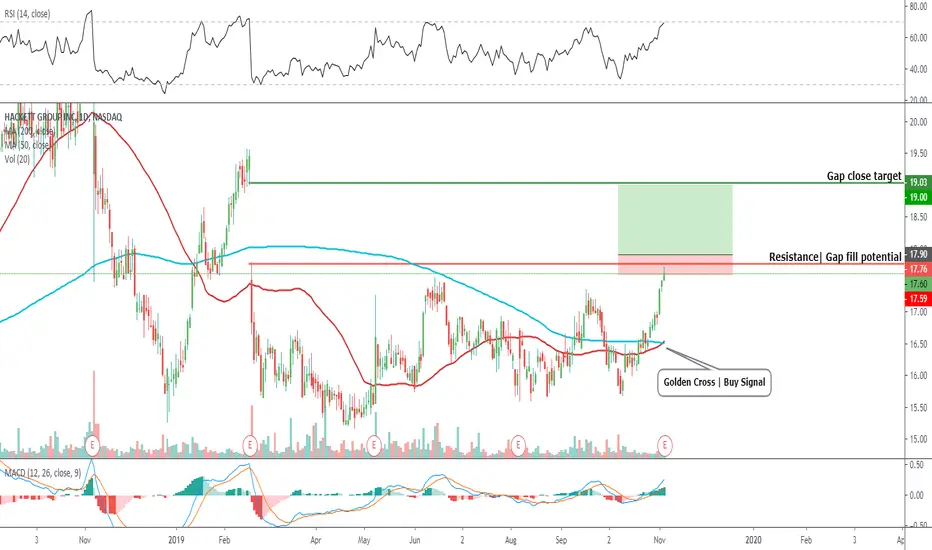
$HCKT Trade the gap in Hackett GroupEntry level $17.90 = Target price $19.00 = Stop loss $17.60
Nice opportunity for a gap fill trade in a strong stock on a bull run, very nice risk / reward trade.
Bullish golden cross occurring , which is a much sought after buy signal.
RSI making a higher high and has room to run higher.
Company prolfile
The Hackett Group, Inc. is an intellectual property-based strategic consultancy and enterprise company, which engages in the provision of business and technology consulting services. The firm offers services include benchmarking, executive advisory, business transformation, enterprise performance management, training, and advisory to global business services. It also produces digital transformation including robotic process automation and enterprise cloud application implementation. The company was founded by Ted A. Fernandez and David N. Dungan in 1991 and is headquartered in Miami, FL.