Next bull: HennessyHennessy is a provider of different funds. The top funds have a 5-star rating from morningstar.
Technical:
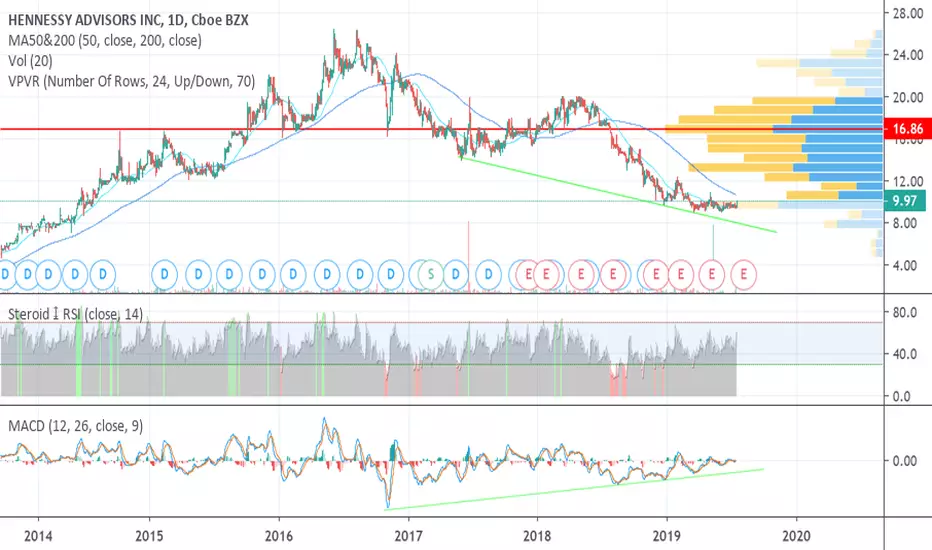
(+) textbook chart pattern (price and volume)
(+) consolidation around 12$ on low volume
(+) low float
(-) very low volume
Fundamental:
(+) Good EPS increase due to a rise in the assets unde
Next report date
—
Report period
—
EPS estimate
—
Revenue estimate
—
1.26 USD
7.10 M USD
29.65 M USD
4.61 M
About Hennessy Advisors, Inc.
Sector
Industry
CEO
Neil Joseph Hennessy
Website
Headquarters
Novato
Founded
1989
FIGI
BBG000F4P4Z0
Hennessy Advisors, Inc. engages in the provision of investment advisory services to a family of open-ended mutual funds and an exchange-traded fund. It offers exchange-traded funds, traditional equity, specialty category, and sector funds, as well as more conservative multi-asset products. The company was founded by Neil Joseph Hennessy on February 1, 1989 and is headquartered in Novato, CA.
Related stocks


Big bullish divergence in Hennessy AdvisorsHennessy Advisors is rated undervalued and high quality by S&P Capital IQ. It's profitable, but it almost always misses earnings estimates. The next report date is August 1. On purely technical grounds, I think the stock may move up ahead of earnings. It's got a big bullish divergence that formed ov
HNNA repeat of previous year Aug-Oct Swing?History repeat itself think 21% return in two months think this is a great entry. Bounced here last August and in 2015.
Entry think may go little lower but entry at 14.40-14.60 would be good.

See all ideas
Summarizing what the indicators are suggesting.
Oscillators
Neutral
SellBuy
Strong sellStrong buy
Strong sellSellNeutralBuyStrong buy
Oscillators
Neutral
SellBuy
Strong sellStrong buy
Strong sellSellNeutralBuyStrong buy
Summary
Neutral
SellBuy
Strong sellStrong buy
Strong sellSellNeutralBuyStrong buy
Summary
Neutral
SellBuy
Strong sellStrong buy
Strong sellSellNeutralBuyStrong buy
Summary
Neutral
SellBuy
Strong sellStrong buy
Strong sellSellNeutralBuyStrong buy
Moving Averages
Neutral
SellBuy
Strong sellStrong buy
Strong sellSellNeutralBuyStrong buy
Moving Averages
Neutral
SellBuy
Strong sellStrong buy
Strong sellSellNeutralBuyStrong buy
Displays a symbol's price movements over previous years to identify recurring trends.
Frequently Asked Questions
The current price of HNNA is 12.40 USD — it has decreased by −2.52% in the past 24 hours. Watch Hennessy Advisors, Inc. stock price performance more closely on the chart.
Depending on the exchange, the stock ticker may vary. For instance, on NASDAQ exchange Hennessy Advisors, Inc. stocks are traded under the ticker HNNA.
HNNA stock has fallen by −1.59% compared to the previous week, the month change is a −1.59% fall, over the last year Hennessy Advisors, Inc. has showed a 49.76% increase.
HNNA reached its all-time high on Jun 7, 2016 with the price of 26.33 USD, and its all-time low was 0.87 USD and was reached on Mar 2, 2009. View more price dynamics on HNNA chart.
See other stocks reaching their highest and lowest prices.
See other stocks reaching their highest and lowest prices.
HNNA stock is 9.23% volatile and has beta coefficient of 0.05. Track Hennessy Advisors, Inc. stock price on the chart and check out the list of the most volatile stocks — is Hennessy Advisors, Inc. there?
Today Hennessy Advisors, Inc. has the market capitalization of 96.54 M, it has increased by 0.07% over the last week.
Yes, you can track Hennessy Advisors, Inc. financials in yearly and quarterly reports right on TradingView.
Hennessy Advisors, Inc. is going to release the next earnings report on Aug 7, 2025. Keep track of upcoming events with our Earnings Calendar.
HNNA net income for the last quarter is 2.58 M USD, while the quarter before that showed 2.83 M USD of net income which accounts for −8.86% change. Track more Hennessy Advisors, Inc. financial stats to get the full picture.
Yes, HNNA dividends are paid quarterly. The last dividend per share was 0.14 USD. As of today, Dividend Yield (TTM)% is 4.44%. Tracking Hennessy Advisors, Inc. dividends might help you take more informed decisions.
Hennessy Advisors, Inc. dividend yield was 5.53% in 2024, and payout ratio reached 59.84%. The year before the numbers were 8.14% and 87.65% correspondingly. See high-dividend stocks and find more opportunities for your portfolio.
As of Aug 3, 2025, the company has 18 employees. See our rating of the largest employees — is Hennessy Advisors, Inc. on this list?
EBITDA measures a company's operating performance, its growth signifies an improvement in the efficiency of a company. Hennessy Advisors, Inc. EBITDA is 13.05 M USD, and current EBITDA margin is 30.73%. See more stats in Hennessy Advisors, Inc. financial statements.
Like other stocks, HNNA shares are traded on stock exchanges, e.g. Nasdaq, Nyse, Euronext, and the easiest way to buy them is through an online stock broker. To do this, you need to open an account and follow a broker's procedures, then start trading. You can trade Hennessy Advisors, Inc. stock right from TradingView charts — choose your broker and connect to your account.
Investing in stocks requires a comprehensive research: you should carefully study all the available data, e.g. company's financials, related news, and its technical analysis. So Hennessy Advisors, Inc. technincal analysis shows the sell today, and its 1 week rating is buy. Since market conditions are prone to changes, it's worth looking a bit further into the future — according to the 1 month rating Hennessy Advisors, Inc. stock shows the buy signal. See more of Hennessy Advisors, Inc. technicals for a more comprehensive analysis.
If you're still not sure, try looking for inspiration in our curated watchlists.
If you're still not sure, try looking for inspiration in our curated watchlists.