−453.51 USD
−8.80 M USD
40.34 M USD
4.62 M
About MicroCloud Hologram Inc.
Sector
Industry
CEO
Guo Hui Kang
Website
Headquarters
Shenzhen
Founded
2020
FIGI
BBG0105X4G82
MicroCloud Hologram, Inc. engages in research, development, and application of holographic technology. It operates through the Holographic Solutions and Holographic Technology Service segments. The company was founded in 2020 and is headquartered in New York, NY.
Related stocks

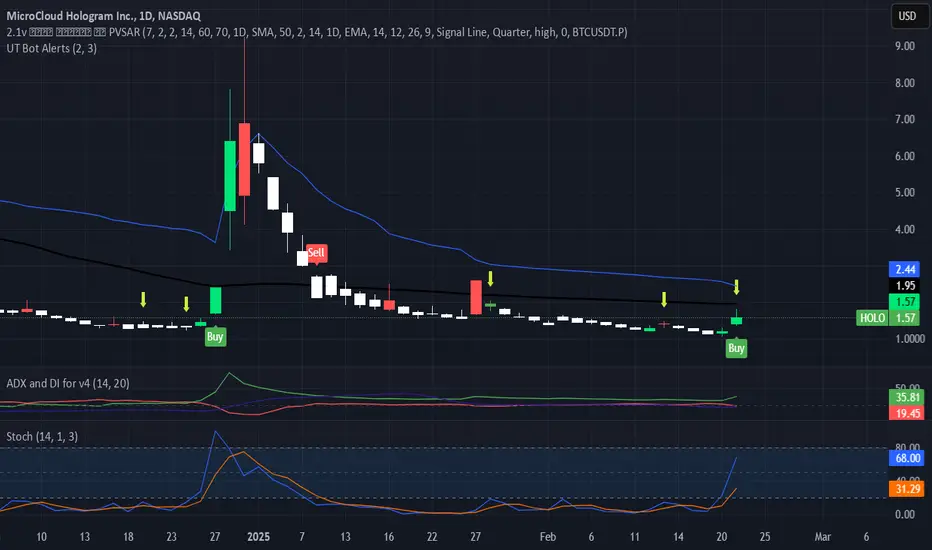
HOLO Daily Chart 1. Price Action & Bollinger Bands
Bollinger Bands: The upper band is around 2.44, the middle (20-day moving average) around 1.57, and the lower band near 0.90.
Current Price: Trading around the lower half of the Bollinger Bands indicates relatively weaker price action in the short term. If price can
Hobo is Deepseek exposure: could run hard!The market has woken up to bad news from China with Deepseek. Not going into detail but its generally bad for semiconductors, especially NVDA - which is quite high priced (understatement).
Been looking for opportunities on the other side of this trade and found HOLO. They will be using DeepSeek R1

HOLO: Will you fly with HOLO?HOLO: Will you fly with HOLO?
-Optimal entry with slow risk and big target.
-Quasimodo pattern.
-Demand volume confirmed and small supply backtest volume confirmed.
.
Wait n see!

Another $28 Million of Toxic Financing is being OfferedWell guys and gals. This is not good news for retail investors. If you're wondering why the stock is not recovering from its previous rally, is real simple the street big investors don't like what this company is doing & neither do I at this point. With little to no transparency, investors had no ch

The Quantum Computing Game / Share Buyback / AquisitionFor those that have been holding congratulations...I must say this has been painful and an experience of a lifetime. Today's press release couldn't have come at a better time! The management team is not asleep, they have been working 9smiles). Ive asked myself, is this company worth SEED_TVCODER77_

Rocket Watch - 29Dec2024 [$HOLO]Watch out for this stock on Monday and next week. Setting up for nice upside and a quick long trade.
Note: This is not a recommendation or investment advice, just a stock to watch. Do your own research.

HOLO buyingA bearish wedge in a positive downward trend. In the event of a breakout, the stock will reach levels of 40 and more.

DFTUNEDFTUNE was acquired by Mengyun Holographic a 100% owned subsidiary of Micro Hologram..
DTUNE is currently developing the Hololens for the Metaverse..& the stock dropped yesterday. Its really interesting reading...
Still long...

Should I stay or Should I goSurprise : More dilution coming $28M CNPA freshly minted stock synthetics for sale.
What does this mean when a company keeps using toxic money to keep financing the operations..
I mean they just raised $125M and they are still raising capital…
The problem here is that the company has stayed so

See all ideas
Summarizing what the indicators are suggesting.
Oscillators
Neutral
SellBuy
Strong sellStrong buy
Strong sellSellNeutralBuyStrong buy
Oscillators
Neutral
SellBuy
Strong sellStrong buy
Strong sellSellNeutralBuyStrong buy
Summary
Neutral
SellBuy
Strong sellStrong buy
Strong sellSellNeutralBuyStrong buy
Summary
Neutral
SellBuy
Strong sellStrong buy
Strong sellSellNeutralBuyStrong buy
Summary
Neutral
SellBuy
Strong sellStrong buy
Strong sellSellNeutralBuyStrong buy
Moving Averages
Neutral
SellBuy
Strong sellStrong buy
Strong sellSellNeutralBuyStrong buy
Moving Averages
Neutral
SellBuy
Strong sellStrong buy
Strong sellSellNeutralBuyStrong buy
Displays a symbol's price movements over previous years to identify recurring trends.
Frequently Asked Questions
The current price of HOLO is 4.32 USD — it has decreased by −5.47% in the past 24 hours. Watch MicroCloud Hologram Inc. stock price performance more closely on the chart.
Depending on the exchange, the stock ticker may vary. For instance, on NASDAQ exchange MicroCloud Hologram Inc. stocks are traded under the ticker HOLO.
HOLO stock has fallen by −16.60% compared to the previous week, the month change is a −9.62% fall, over the last year MicroCloud Hologram Inc. has showed a −98.85% decrease.
HOLO reached its all-time high on Sep 19, 2022 with the price of 280,000.00 USD, and its all-time low was 4.16 USD and was reached on Jun 16, 2025. View more price dynamics on HOLO chart.
See other stocks reaching their highest and lowest prices.
See other stocks reaching their highest and lowest prices.
HOLO stock is 7.03% volatile and has beta coefficient of 1.00. Track MicroCloud Hologram Inc. stock price on the chart and check out the list of the most volatile stocks — is MicroCloud Hologram Inc. there?
Today MicroCloud Hologram Inc. has the market capitalization of 20.42 M, it has decreased by −7.28% over the last week.
Yes, you can track MicroCloud Hologram Inc. financials in yearly and quarterly reports right on TradingView.
HOLO net income for the last half-year is 8.00 M USD, while the previous report showed −16.73 M USD of net income which accounts for 147.79% change. Track more MicroCloud Hologram Inc. financial stats to get the full picture.
No, HOLO doesn't pay any dividends to its shareholders. But don't worry, we've prepared a list of high-dividend stocks for you.
As of Aug 2, 2025, the company has 64 employees. See our rating of the largest employees — is MicroCloud Hologram Inc. on this list?
EBITDA measures a company's operating performance, its growth signifies an improvement in the efficiency of a company. MicroCloud Hologram Inc. EBITDA is −18.89 M USD, and current EBITDA margin is −46.94%. See more stats in MicroCloud Hologram Inc. financial statements.
Like other stocks, HOLO shares are traded on stock exchanges, e.g. Nasdaq, Nyse, Euronext, and the easiest way to buy them is through an online stock broker. To do this, you need to open an account and follow a broker's procedures, then start trading. You can trade MicroCloud Hologram Inc. stock right from TradingView charts — choose your broker and connect to your account.
Investing in stocks requires a comprehensive research: you should carefully study all the available data, e.g. company's financials, related news, and its technical analysis. So MicroCloud Hologram Inc. technincal analysis shows the sell today, and its 1 week rating is sell. Since market conditions are prone to changes, it's worth looking a bit further into the future — according to the 1 month rating MicroCloud Hologram Inc. stock shows the sell signal. See more of MicroCloud Hologram Inc. technicals for a more comprehensive analysis.
If you're still not sure, try looking for inspiration in our curated watchlists.
If you're still not sure, try looking for inspiration in our curated watchlists.