HOLO trade ideas

HOLO Daily Chart 1. Price Action & Bollinger Bands
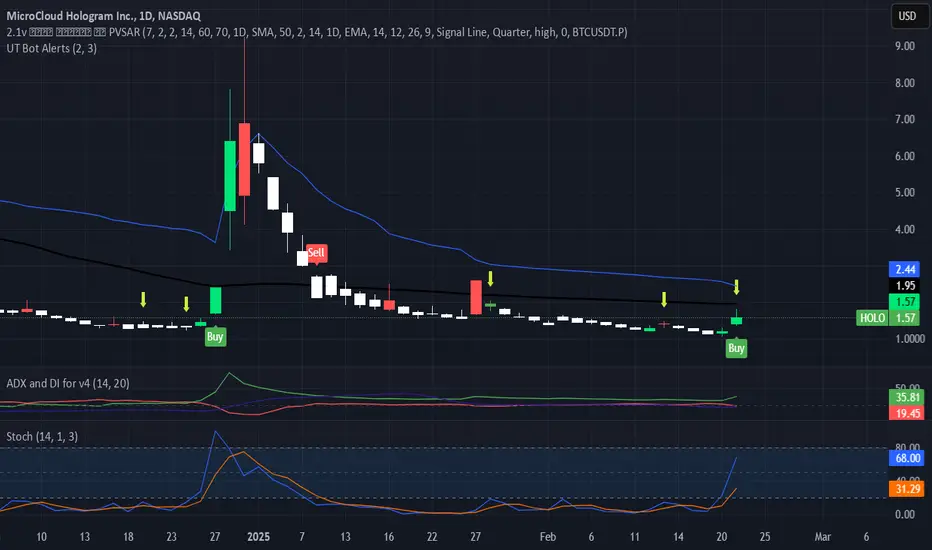
Bollinger Bands: The upper band is around 2.44, the middle (20-day moving average) around 1.57, and the lower band near 0.90.
Current Price: Trading around the lower half of the Bollinger Bands indicates relatively weaker price action in the short term. If price can break back above the middle band (~1.57), it could suggest a stronger bullish reversal attempt.
2. Buy/Sell Signals on Chart
The chart software is showing recent “Buy” labels, possibly triggered by an oversold reading or a bullish crossover of some kind. While these signals can be useful, they’re generally more reliable when combined with other indicators (volume, support/resistance, etc.).
3. ADX and DMI (+DI, –DI)
ADX (~35): This level of ADX suggests a moderately strong trend in place (anything above 25–30 often indicates a more definitive trend).
+DI vs. –DI: With –DI slightly higher than +DI (19.6 vs. 16.9), sellers still have a small edge. However, if +DI crosses above –DI, it may indicate a shift in momentum back to the bulls.
4. Stochastic Oscillator
Stochastic appears to be near or below 20 (oversold territory). That can signal a potential rebound, but oversold conditions can persist in a strong downtrend. A confirmed bullish crossover in Stochastics often adds confidence to a reversal scenario.
5. Support and Resistance Zones
Immediate Support: Near the lower Bollinger Band around 0.90. A breakdown below this zone could lead to further downside.
Resistance: Around the middle Bollinger Band (~1.57). A clear break above 1.57–1.60 with volume could open the door toward the upper Bollinger Band (~2.44).
6. Overall Takeaways
Short-Term Bias: Slightly bearish to neutral, given the price is below the 20-day moving average and the –DI is still above +DI.
Potential Reversal: The oversold Stochastic reading and a “Buy” signal from your chart tool hint at a possible bounce. Watch for a crossover of +DI above –DI and a close above the middle Bollinger band to confirm any bullish momentum.
Risk Management: If you are trading this, consider watching that 0.90 support closely. A decisive break lower could invalidate a near-term bounce.
Hobo is Deepseek exposure: could run hard!The market has woken up to bad news from China with Deepseek. Not going into detail but its generally bad for semiconductors, especially NVDA - which is quite high priced (understatement).
Been looking for opportunities on the other side of this trade and found HOLO. They will be using DeepSeek R1 as the model for their holographic AI engine. Thing is: Deepseek is the hype (just like AI and Quantum was before) and HOLO is probably one of the few stocks that offers exposure AND its only sitting at a 33 million market cap. Jokes, much higher! First target: $7, if rally can sustain for multiple weeks: $18.
I literally just bought, i honestly dont care if it pumped 50% pre-market - its a sign of strength. Let's see, obviously a risky play but also makes a lot of sense. Chart looks good after a retest of previous resistance.

HOLO: Will you fly with HOLO?HOLO: Will you fly with HOLO?
-Optimal entry with slow risk and big target.
-Quasimodo pattern.
-Demand volume confirmed and small supply backtest volume confirmed.
.
Wait n see!

Another $28 Million of Toxic Financing is being OfferedWell guys and gals. This is not good news for retail investors. If you're wondering why the stock is not recovering from its previous rally, is real simple the street big investors don't like what this company is doing & neither do I at this point. With little to no transparency, investors had no choice but to sell the news! I hope everyone averaged down and was able to recoup losses. No one really knows what this company is planning on doing with the proceeds from the sale of the convertible notes other than the standard language, for working capital and general corporate purposes.
Now if you read the prospectus S-22 under capitalization and indebtedness they clearly say that as of 06/30/2024 the outstanding stand at 28,095,686 adjusted for 1:20 on 10/9/2024. its unclear if there will be additional dilution at this point.
The drop in the price from $9 was massive and the stock could not hold its gains, very concerning.
The price as f this post is 3.15
Holding & still Long. Dollar cost averaged $3.88

The Quantum Computing Game / Share Buyback / AquisitionFor those that have been holding congratulations...I must say this has been painful and an experience of a lifetime. Today's press release couldn't have come at a better time! The management team is not asleep, they have been working 9smiles). Ive asked myself, is this company worth SEED_TVCODER77_ETHBTCDATA:10B ? What will it take to reach this astronomical valuation? What will it take for the company to trade up to a valuation of SEED_TVCODER77_ETHBTCDATA:10B that would in essence place the stock at $2000 a share.
The race to a new frontier Quantum! This like discovering gold in California. You have your Kardashians and then you have your vendors & your merchants selling picks, pans, tents and shovels! I don't want to be a gold digger, I would rather sell tooth paste, toothbrushes and dental floss to all the gold diggers!
Im hoping..big hope! that the company does a share buyback! Lets hope that the company took advantage of this crypto run!
Acquisition..lets hope the company has its eyes on companies generating real revenue!
Products: The only product that I want to see, I believe will take the market by storm is pure light hologram images! I want to see my grand kids standing next to me in pure light hologram images and vice-versa because they are ten hours away from me or my brother that lives three states east of me in the form of a hologram!
$2000 a share?
Not Financial Advice!
I'm holding! its worth noting that you can never go wrong with profit taking.
Thank you Jehovah.

Rocket Watch - 29Dec2024 [$HOLO]Watch out for this stock on Monday and next week. Setting up for nice upside and a quick long trade.
Note: This is not a recommendation or investment advice, just a stock to watch. Do your own research.

HOLO buyingA bearish wedge in a positive downward trend. In the event of a breakout, the stock will reach levels of 40 and more.

DFTUNEDFTUNE was acquired by Mengyun Holographic a 100% owned subsidiary of Micro Hologram..
DTUNE is currently developing the Hololens for the Metaverse..& the stock dropped yesterday. Its really interesting reading...
Still long...

Should I stay or Should I goSurprise : More dilution coming $28M CNPA freshly minted stock synthetics for sale.
What does this mean when a company keeps using toxic money to keep financing the operations..
I mean they just raised $125M and they are still raising capital…
The problem here is that the company has stayed so quiet and they are not defending the stock ..
The only news that this company has released is bad news or toxic news..
Now BYD just announced unbelievable financials surpassing TESLA in EV sales, well that’s great but we keep dropping like a rock out in the middle of the Atlantic .
So therefore we are all grown ups and its decision time hold or get out of a stock that drops every single day while the US markets are roaring like the 1920’s

REVERSAL ALERT! Santa Claus is coming to town!Man that was brutal $3.18! Why the pain? why need some gain! Timmy save us1 Tim Cook doing some shopping in /china..kicking the tires.....a deal..
325B in stimulus that s 7.77X Yuan.. lots to go around..Merry Christmas!
Technically overdone over sold..over kill!
I f there was ever a time when we as longs have needed a blockbuster press release is in this very hour.. The darkest hour..
i buy more...

In ComplianceWe finally have some news, the company has received written notification from NASDAQ that the company has regained NASDAQ's $1 min bid price according to rule 5550(a)(2).
1. Under Nasdaq Rule 5550(a)(2) (Primary Equity Security listed on the Nasdaq Capital Market) and Rule 5450(a)(1) (Primary Equity Security listed on the Nasdaq Global or Global Select Markets), listed companies must maintain a minimum bid price of $1.00 per share.
Staying positive , thinking long term, think HARVARD..
Looking forward to a violent volumed breakout...out of this pendent, coiled, stubborn wedge.
I think we see $13 on the next leg up...fingers crossed.

Wax On Wax Off Daniel Son..Do you think we would’ve had some relief by now? Possibly a leg up. You know it’s interesting is that Apple is trying to get their Vision Pro to $1800 retail. The other thing that’s interesting is that Tim Cook is visiting China after a $325 billion stimulus announcement. I’m sure that everything‘s been chopped down so much that it’s like a fire sale over there. Technology garage sale prices… That’s what I think is going on, but then again, who am I?
Back at the batcave.. Holy cow, took it right to the jaw here.. But at 80 Market cap is attractive valuation , growing CARG improving CFC..
Once again, this is not financial advice, but if the company were to issue a press release on a product or an update with their current partners such as BYD or something on Samsung, the stock should perform.
The Vision Pro is awesome, I highly recommend that you schedule a demo ASAP.
The stock looks oversold and bottomed so I added..
Stubborn Long..

ALL PAIN & NO GAIN?Has anyone noticed the short interest om Fintel? I'm not sure if this accurate but 38% seems wonderful! The amount of shares available to short has had some wild swings in the last couple of days to the point of no shares available to short. The technicals are shouting a severe oversold situation, but floors sometimes don't hold and they collapse leading to lower stock prices. I prefer a short squeeze that everyone has been waiting on? Lets no forget that we no longer non-compliant, this news alone should put the stock at $60! So many questions..Why is the company so quiet, why no announcements, no update? Would like an update on the recent funds and how they are being deployed and some guidance. I'm still bullish and looking forward to a bull run here, fingers crossed.
My PT1 $900
My PT 2 $2200
Best Wishes Longs

Imminent The Hologram market to eclipse $50B in spending! The __8__month ___38 week_ decending painful frustrating wedge stock pattern is one of the most rewarding bullish patterns that I trade for all of my accounts. We are in the trifecta eye of the storm..the storm has been brewing for several days weeks months now..The cash reserves have been inflated , the restructuring of the stock was genius bringing the float back to the previous ralley $1.50 to $108 …now we need some catalyst news. I believe the move will be epic. What does one do with epic moves? You hold ride the stock out..I strongly believe that the Hologram applications are end less and MicroHologram has great prospects in this SGX:43B by 2025 & can easily explode to $100B in 2026.
HELLO! growing market.
The stock in my opinion will do the opposite of what we have seen over last several months pure destruction of wealth. Just in the past 6 months revenues have shown an increase of $100% thy are forecasted to grow to $64 million revenue up from $28 million revenue just under the $70M 2022 all-time high revenue!
The thing you have to remember is that when the float gets absorbed and all bought up, it will be done through the dark pool quietly and secretly.. Don't be surprised if they they take this post down. A ridiculous amount of buying through the dark pool! I couldn't share a link. Millions of shares are being swallowed up.. It will literally take no buying pressure to get the stock going with some killer news..
we wait...huckleberry!
Price target $1900-$2300
NFA

$1900 price target possible?Is it possible for the stock to test $1250-$2000 a share eventually topping out at a SEED_TVCODER77_ETHBTCDATA:10B market cap?.
The possibility is as alive as the spirit of Jehovah, Jesus, the Holy Spirit and the American dream of home ownership, baseball, apple pie with ice cream and a movie in Netflix! All of these things are possible with God and good food!
Scenario 1…the stock float gets absorbed all 5,400,000 floating shares snapped up, gobbled uo like.chum in a tiger shark infested waters off of Japan…
Once the float is locked up and not sold..the sky is the limit ..pending news… the Samsung news on a multi billion deal! Or the Hologram deal with the NFL…
As long as that float gets parked the stock flys to $25K. Am I high yes but that’s not the point ..the point is stock manipulation..that’s the dirty word… but does anyone object to a$1900 stock price stemming from float lock up and a rapid rise in wealth with the stock pricing sticking like an INDEX fund or a gap up and halt all dat then a run AH and rinse repeat until we reach heaven!..any objections?

Here's your Buy SignalHolo hitting it's pivotal up charge trend on the monthly. Get in before its too late. Dont be let wading in the water hoping to float. Get in now so we pay our bills next week. Lfg

Sharing my Buy SignalSomeone out there told me to share my buy signals so I made this little stupid video for all you hard nosed apes out there looking to make a buck. Holo is about to explode. We see a repetitive pattern for gains. Your best best is to buy today at $5 so you don't kick yourself when it hits $30 on Monday. Here is your buy signal.

It’s going to PLUTO man!This way overdue reverse stock split was completely overdue.. now we need some news…corporate developments on a product release…
The float has been dwindled down to such a favorable position that it’s gone from 100M to 5M reflecting a 1:20 split.
The cash on hand / share certainly reflects a discount…
The stock can certainly copy HKD type of astronomical type of move…the ugly part is that the stock price will likely stick..wiping out shorts…ugly ugly ugly to be short ..

Financial suicide or an actual Opporunity410m O/S & floating... so much for that long awaited squeeze.. Why the destruction of wealth? Why so quiet? Where is the product?
Im sure we are all aware and waiting on a reverse split. some news... with the stock trading at .24 cents!
The stock needs something, ideally a stock re-purchase / buyback followed up by corporate events such as signing a deal with a MegaCap.. (Samsung, BYD)
Im not sure how true the Samsung rumors are but the stock is not reflecting any of these rumors. Now if my mobile smart phone had hologram capabilities on my new Samsung, that would be so cool!
Lets say I want to buy a classic abandoned 1970 Pontiac GTO in Florida but I live in California, well having a cell phone with hologram capabilities would make sense to this new order of dominance in the market. Having the option to participate in hologram conversations I believe would trump Face-time! Imagine being in the presence of a stranger walking around as a hologram inspecting the merchandise you want to buy but on a hologram call. Lets say your working with a buyer or seller because you're a realtor and they live 4 hrs away and you want to show a property or inspect a property from 4 hrs away! Lets say your work for Auto-zone and you want to show a consultant the part that you need for your automobile but you don't know the part# nor the name of the part but the consultant knows every part on your engine ( problem solved). Lets say you a doctor operating and a specialist is in Europe and the patient is now a hologram...not sure how that would pan out but you folks understand the potential and the magnitude of beta that is building up here. You're divorced but X has custody of the kids and they live out of state with new hubby! Not a problem Hologram yourself right into that birthday party and don't miss these precious moments!
Relatives you haven't talked to or seen in weeks, months or years...all on hologram!

HOLO MORE PAIN TO COMEHello traders as we can see Holo is in a strong downtrend on the linear regression channel. I am using Renko to filter the noise. Holo has made some gains but then has those gains erased and then some the following few days. The RSI is struggling to come back up. The bottom of the channel where price action could go is 0.05-0.07 if no catalyst takes place e.g news from the company.

HOLO is bouncing off the lows after a weekVolume is increasing over the last week or so. It gave a buy signal a week ago and reached almost 0.80c. Now volume is coming in (early stage, very early observation). Price is around 0.40c creates a good risk / reward. Adjust your position sizing accordingly and let the trade show her true intention. Trade well

Institutional Ownership is up 1100% WHAT ? They are buying this?July and August were two months that I saw Institutional buying...
The very first question everyone should be asking themselves, why are these funds buying a penny stock? Most funds like Susquehanna do not mess around with penny stocks! lol they just don't buy junk!. they don't buy garbage, dead beat technology they don't touch it!
What is really going on? Ha?
1. 2024-08-14 13F UBS Group AG Long 32,859 shares
2. 2024-08-15 13F Susquehanna International Group, Llp Long 132,237
3. 2024-08-15 13F Jane Street Group, Llc 96,871
4. 2024-07-31 13F Commonwealth Equity Services, Llc Long 428,000
5. 2024-08-07 13F LPL Financial LLC Long 50,300
I don't know if these funds are in favor of a reverse stock split and lets not forget the recent CNPA for 18M... Susquenna & Citadel were recently accused of spoofing, google spoofing..
im not sure if its a good think they are long but im glad Citadel and the whole racket are getting sued!
Cash on Hand 185M..
Burn 900K/Q
125M O/S
5M Shares short
We need some news something from the Gods of Silicon Valley! A FANG collaboration as i mentioned on another board.
A. Netflix: watching Netflix movies in hologram with the characters jumping out of the screen ; JAWS jumping out of the screen!
B. Google: Searching items, businesses in hologram AR viewing a property in hologram.
C. Amazon; searching items & visiting a virtual store in hologram mode.
D. META; Mark Zuckerberg was recently Youtube interview and the Co is exploring hologram and are actually working on lenses.
Im still holding...LONG i tried adding link but im not a paying member.
